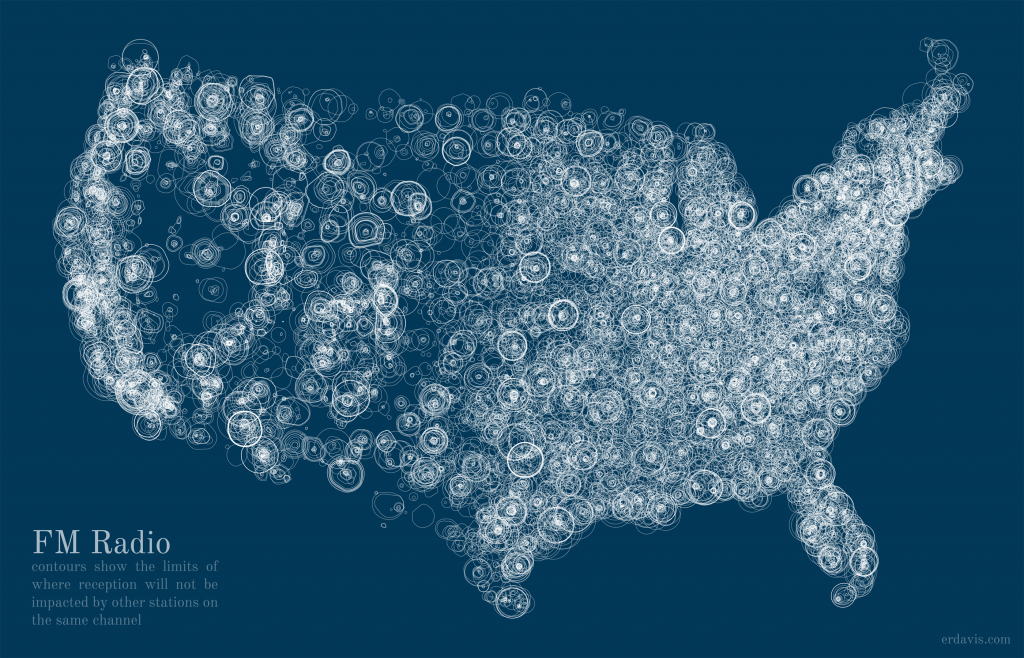
(Source: ERDavis.com)
This project, like the one before it, started as an offshoot of another project that I’ll finish… someday…
I start one project, which brings up questions I need to answer in other projects, so I start those projects, which lead to more questions… and before I know it I have a tangled mess that’ll take months to sort out. To illustrate, there’s currently 11 projects in my “Active” queue and 11 more in my “Paused” queue. I’m personally very proud that I get anything done at all!
For this particular tangled project mess, I needed to see how many classical music radio stations there are in the States. That quickly lead to wanting to plot where those classical stations broadcast. That lead to a burning desire to map all radio station broadcast areas, ever, and also to map how many radio stations broadcast in a given area.
[…]I started by simply plotting the service contours of the 20,000-odd stations on my list. I love the way this looks, like phosphorescent jellyfish or raindrops on water.[…]
Click here to read the full article and view all images.

