by Pete Jernakoff (K3KMS)
Introduction
Greetings, fellow shortwave radio aficionados! Although I have been an avid shortwave radio listener (SWL) since the mid-1970s, my interest in the North American shortwave pirate radio scene was, until recently, limited to occasional listening around major holidays. That changed a few months ago after a conversation with a friend on the subject. He had recently heard an NPR segment about pirate radio and, knowing I’m a longtime SWL, had plenty of questions. To my surprise, answering them sparked a much bigger interest in this corner of the hobby. Better late than never, I suppose!
That newfound curiosity led me to wonder: what might the data reveal if someone compiled and analyzed several weeks’ worth of pirate radio logs from the North American Shortwave Pirate section of the indispensable HF Underground website (a hub where listeners can post their logs of stations heard in near real time)?
I decided to find out. However, rather than performing the initial review manually—a tedious process at best—I delegated the data collection work to Grok Bot, an AI assistant I’ve recently started using to automate tasks and to research various topics. (Please note I have no affiliation with Grok other than paying for my subscription.)
I asked the bot to check the aforementioned section every night at 10:15 PM EDT for 37 consecutive days (Sept. 23 to Oct. 29, 2026). Each night, it grabbed the 15 most recent logs posted just before the 10:15 PM cutoff, extracting the station name, frequency, broadcasting mode, UTC time, and UTC date straight into an Excel spreadsheet. (Note that on a very busy night, anything beyond those 15 posts would have been missed, so the busiest nights may be slightly undercounted.) Duplicate logs were automatically removed, and unidentified stations (typically labeled in posts as “Unid”) were filtered out to keep the dataset clean.
After the review period concluded, I had the bot run pivot table analyses on the data. Summaries of these are presented below, preceded by a few additional comments regarding the data collection methodology:
The dataset is based on what listeners chose to post to HF Underground, so it reflects who was listening as much as who was transmitting.
As noted above, logging times and dates are UTC-based. Since UTC ran four hours ahead of EDT during the review period, anything logged between 0000 and 0359 UTC actually happened the previous evening here on the U.S. East Coast (specifically Wilmington, Delaware).
Station name variants were merged when they were clearly the same station (the variations coming, for example, from minor spelling, capitalization, and suffix differences in the posted logs); the merging process took 118 raw names down to 85.
Although logs of unidentified stations were left out, “Unknown Radio” appears to be a real station name, so it was counted.
The last day, Oct. 29 (UTC day), was still in progress when the last bits of data were pulled and thus only holds two logs.
I recognize that, for many veteran shortwave pirate radio listeners, the analysis results summarized below will contain few, if any, surprises. The purpose of this post is not to present groundbreaking findings but rather to demonstrate how AI can add new dimensions to the shortwave radio listening hobby. In this case, that means applying AI-assisted techniques to the simple (but time-consuming) collection, tracking, and analysis of pirate radio station data.
And now on to the summaries!
Data Analysis Summary
At a Glance
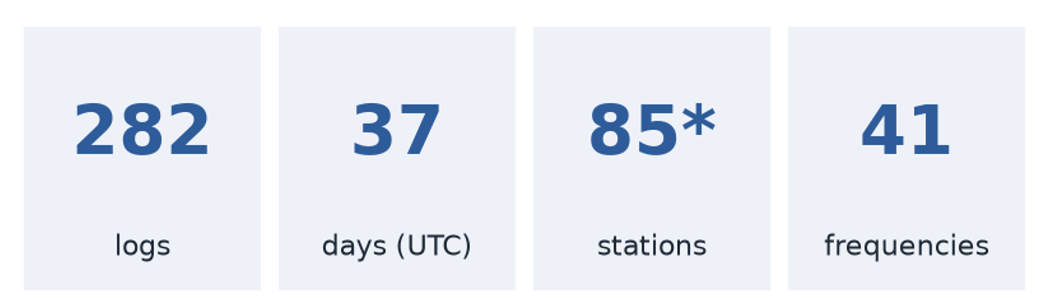
Over 37 days (5.3 weeks), 282 North American pirate radio logs were scraped from the HF Underground website, an average of 7.6 per day. Those logs covered 85 stations heard on 41 different frequencies (Figure 1). One caveat on that 85 value: it’s an upper limit because some operators probably broadcast under different station names on different nights. The true number of distinct stations is likely lower.
Figure 1. The entire dataset at a glance (* = upper limit).
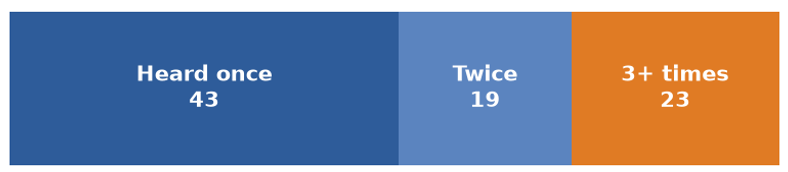
Only 23 stations (27%) were logged three or more times, 19 (22%) twice, and 43 (51%) just once (Figure 2). That core group of 23 accounted for 201 of the 282 logs (71%), while most stations turned up only once or twice.
Figure 2. How many times each of the 85 stations was logged.
Daily Numbers
Figure 3 shows the total number of logs compiled by day of the week (UTC day). Unsurprisingly, shortwave pirate broadcasters were considerably more active on weekends, with Saturday and Sunday accounting for roughly 40% of all logs. It is important to keep the UTC offset in mind, however. A log time of 0100 UTC on Sunday actually corresponds to Saturday evening on the U.S. East Coast (my listening region). Counted by Eastern U.S. (local) date, Saturday had 65 logs (23%), more than any other day.
Figure 3. Total logs by day of the week (UTC day).
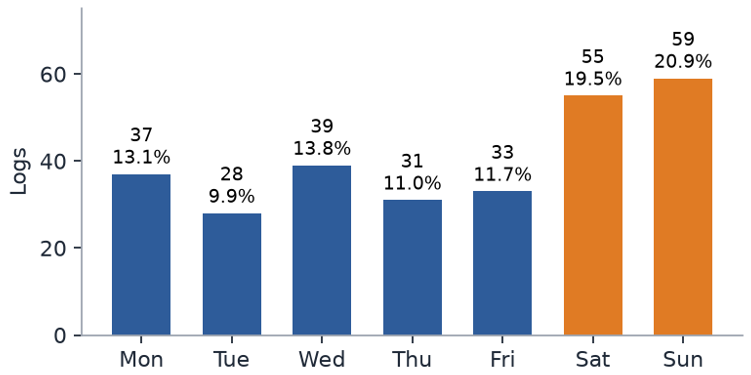
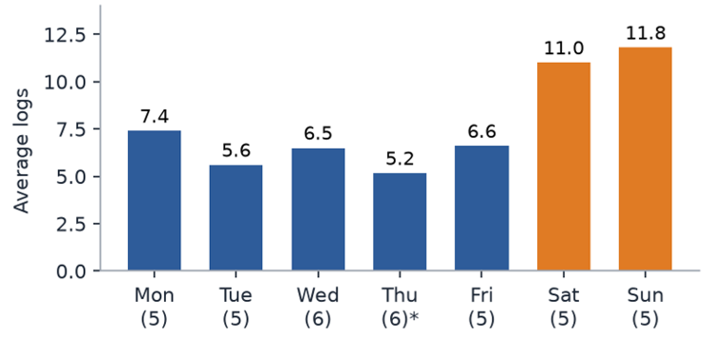
The totals shown in Figure 3 should be interpreted with some caution, as the review period included six Wednesdays and Thursdays, but only five occurrences of the other weekdays. Daily averages therefore provide a more meaningful comparison. As shown in Figure 4, weekend days averaged 11.4 recorded logs (range 11.0–11.8), nearly double the weekday average of 6.2 (range 5.2–7.4). Note that Thursday’s average is somewhat understated because Oct. 29 (a Thursday and the final day of the review period) included only a partial night of monitoring. Excluding that outlier increases Thursday’s average to 5.8 logs per day.
Figure 4. Average logs per UTC day. The number in parentheses is how many times that day fell in the review period. *Thursday includes the partial final day, Oct. 29.
Hourly Numbers
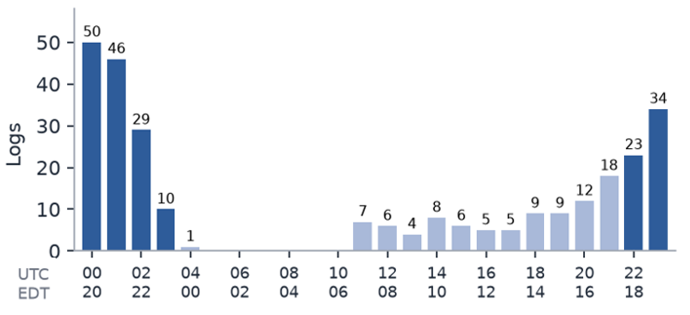
As might be expected, North American shortwave pirate radio broadcasters are creatures of the evening. Figure 5 shows that 192 of the 282 recorded logs (68%) occurred between 2200 and 0359 UTC, corresponding to 6 PM–midnight EDT. Activity peaked during the 0000–0059 UTC hour (8–9 PM EDT), which alone accounted for 50 logs, making it the single busiest hour of the day. Daytime activity was lighter: about one log in five (59 logs, 21%) fell between 1100 and 1959 UTC (7 AM–4 PM EDT). Nothing at all was logged between 0500 and 1059 UTC (1–7 AM EDT). This pattern is consistent with the tendency of most operators to target audiences during the hours when potential listeners are most likely to be tuning in, while also taking advantage of favorable nighttime propagation conditions on the HF bands.
Figure 5. Total logs by hour. Top row of hour labels is UTC; bottom row is EDT (UTC–4).
Station Names
Table A1 provided in the appendix lists the names of all 85 stations logged during the review period with the number of times each was heard shown in parentheses. Recall that just over half (43 stations) were logged only once during the five-week review window, giving the list a long tail of one-off pop-ups alongside the familiar regulars. From Thunder Chicken Radio and Outhouse Radio to Neighbors Having Coffee and Pizza Toppings Spy Station, the names shown demonstrate that pirate radio operators are a creative and whimsical bunch when it comes to naming their stations, a spirit that is often reflected, at least to my ears, in the content that they broadcast.
Most Prevalent Stations
Figure 6 ranks the top 10 stations by total recorded logs, while also tracking the number of distinct UTC days each was logged. Liquid Radio was by far the most logged station, racking up 34 logs across 30 different days. Route 66 Radio (21 logs over 19 days), WTPK (19 logs over 15 days), and Bandaid Radio (18 logs over 18 days) round out a distinct top four. Beyond that tier, activity levels drop off fairly quickly.
Figure 6. Top 10 stations by number of logs, with the number of distinct UTC days (in parentheses) each was logged.
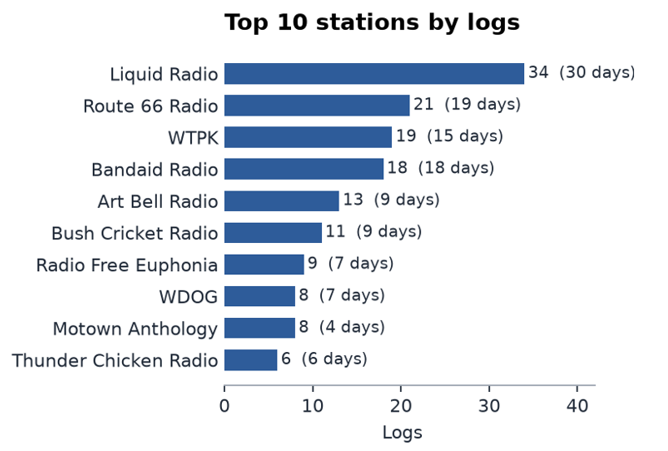
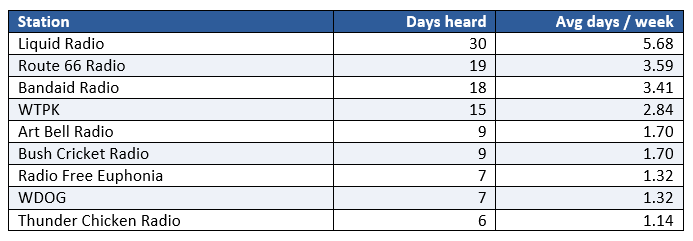
Looking at the data in Figure 6 another way, Table 1 shows the average number of days per week each station was logged, for stations logged on six or more days. Note that the most logged station, Liquid Radio, was heard on average nearly six days a week. Route 66 Radio and Bandaid Radio were the next most dependable, turning up about three and a half days a week, with WTPK close behind at nearly three. After that the drop-off is steep: the remaining five stations averaged only one to two days a week.
Table 1. Stations heard on six or more days of the 37-day review period, with average days heard per week.
Broadcasting Frequencies
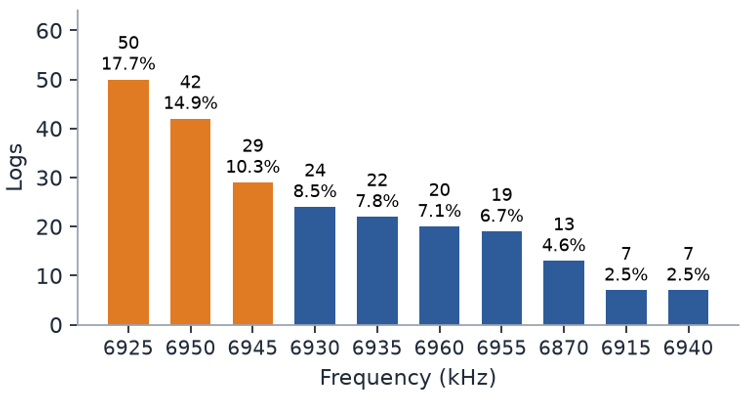
Figure 7 shows the 10 most commonly logged frequencies, which together account for 82.6% of all recorded logs (233 of 282). All of these frequencies fall within the well-established, albeit unofficial, 43-meter pirate broadcast band (6850–6999 kHz). Activity within the band extended beyond these core frequencies, however, with an additional 18 frequencies also logged. Individually, each of these frequencies accounted for only one to four logs, but collectively they contributed 28 additional logs.
Figure 7. The 10 most logged frequencies and their share of all 282 logs.
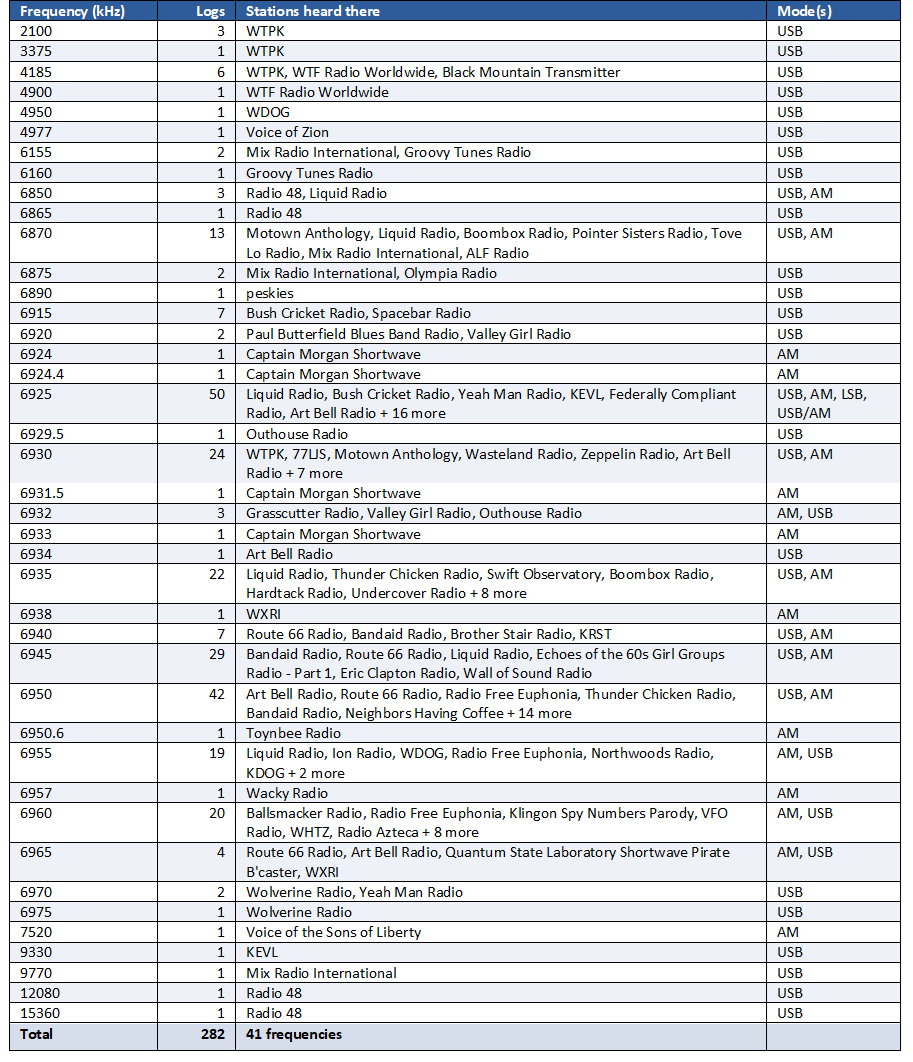
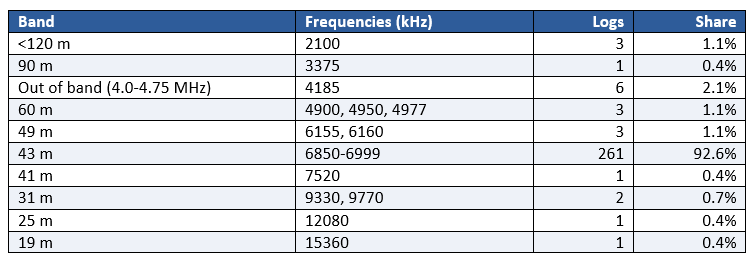
The remaining 21 logs falling outside the traditional pirate broadcast band accounted for just 7.4% of all recorded logs. These logs were spread from 2100 kHz to 15360 kHz (Table 2). The most popular out-of-band spot was 4185 kHz (6 logs: WTPK, WTF Radio Worldwide, and Black Mountain Transmitter). For the complete list of all 41 frequencies, with the stations and modes heard on each, see Table A2 in the appendix at the end of this post.
Table 2. Number and percentage of logs by frequency and associated band.
Broadcasting Mode
From a broadcasting mode standpoint, upper sideband (USB) was by far the most prevalent mode, accounting for approximately two-thirds of all recorded logs (192 logs, 68.1%; Figure 8). Amplitude modulation (AM) accounted for nearly all of the remaining entries (88 logs, 31.2%). The only exceptions were a single lower sideband (LSB) log (WDOG, logged as WDOG South American Service) and one USB/AM entry for KEVL (logged as KEVL Sponge Bob Radio), which likely reflects a mid-broadcast change in operating mode.
Figure 8. Logs by mode.
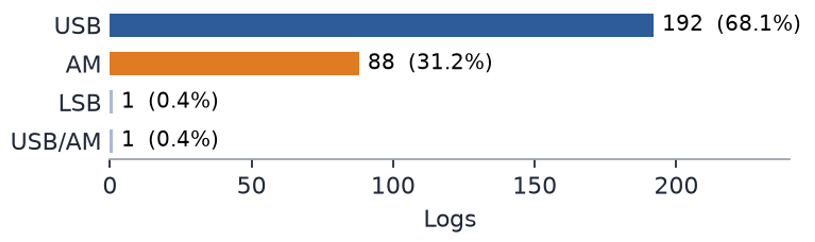
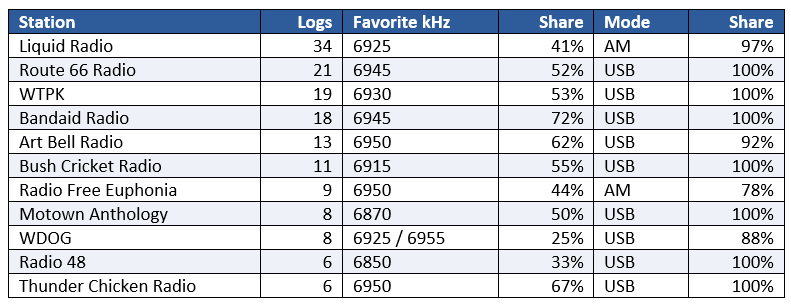
Table 3 shows the favorite frequency and broadcasting mode for those stations with six or more recorded logs. The pattern that emerges is that the regulars stick to one mode more than to one channel. Nine of the eleven used their favorite mode at least 90% of the time (seven of them exclusively), but their favorite frequency only about half the time.
Table 3. Favorite frequency and mode for stations with six or more logs. “Share” is that frequency’s or mode’s share of the station’s logs.
And one stray…
One station stood out by straying well beyond the usual pirate frequencies: Mix Radio International. It was logged on 9770 kHz (31-meter band), relayed Radio 48 on 15360 kHz (19-meter band) and 12080 kHz (25-meter band)—both in the early afternoon Eastern U.S. time—and even turned up on 6155 kHz in the 49-meter band (Table 4). Only two other stations were logged above the 43-meter band, once each: Voice of the Sons of Liberty on 7520 kHz and KEVL on 9330 kHz.
Table 4. Mix Radio International logs outside the 43-meter band. Two of these are relays of Radio 48; two additional relays were in-band on 6850 kHz. All four relays are counted under Radio 48 in Table A1 in the appendix.

Wrapping up
So, what did five weeks of compiling and analyzing HF Underground derived, pirate radio logs appear to indicate? Distilling it down to the essentials, if you want to reliably hear North American pirate radio broadcasters, tune to the 43-meter band, especially 6925, 6945, and 6950 kHz, between 6 PM and midnight Eastern U.S. time, with Saturday evening your best bet. (Friday evening will be your next best bet.) Keep the radio on USB for starters but be ready to switch to AM (Liquid Radio, for one, used AM in 97% of its logs). You’ll probably hear the few regulars first (e.g., Liquid Radio, Route 66 Radio, WTPK, and Bandaid Radio), but tuning around to other frequencies will soon net you quite a number of other stations that broadcast less frequently. And, of course, frequent the HF Underground website often. Never knowing who will pop up next as you roam the pirate broadcast band is a big part of the fun of this corner of the SWL hobby!
And, yes, I did use AI tools (several, in fact) to help with the writing of this post (fact-checking, formatting, consistency, clarity, readability, grammar, etc.).
73,
-Pete Jernakoff (K3KMS)-
Appendix
Table A1. All 85 stations logged, Sept. 23 to Oct. 29, 2026 (UTC), A to Z (a leading “The” is ignored). Note that Unknown Radio is a logged station and that Radio 48’s six logs include four relays via Mix Radio International.
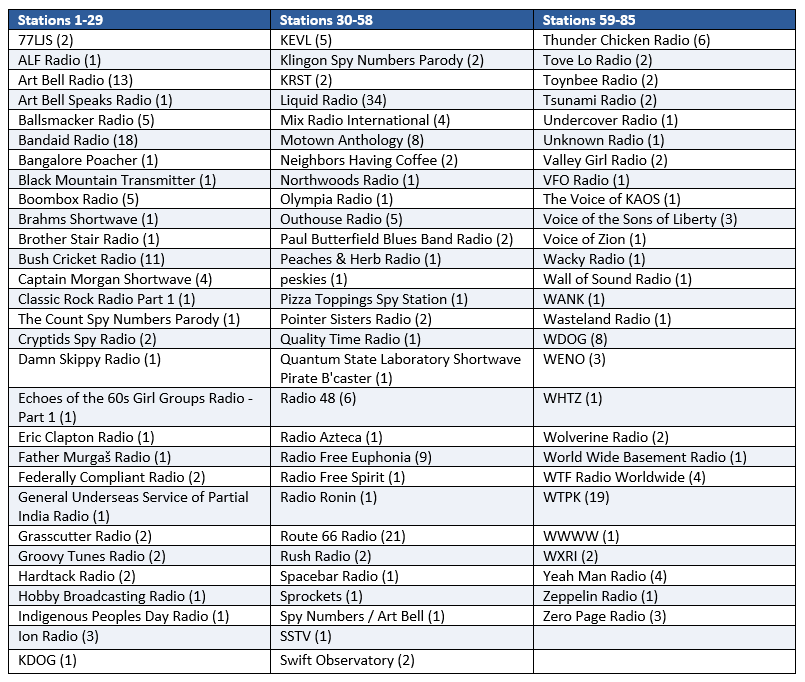
Table A2. All 41 frequencies, Sept. 23 to Oct. 29, 2026 (UTC). Stations (merged names) and modes are listed most logged first; “+ N more” counts the rest. The one “6925/6900” log is counted as 6925 kHz.