The following article dives into medium wave (MW) radio propagation during the 2023 annular solar eclipse, building upon insights from the 2017 total solar eclipse when DXers made broadband radio recordings of the whole MW band for the first time. Unlike that previous study, the 2023 research took a methodical approach, with standardized data collection, stable receivers, and GPS-synchronized frequency locking. Thirteen radio enthusiasts across North America and Europe contributed to the study, capturing 10 Terabytes of SDR data. Using Carrier Sleuth software, researchers pinpointed key signal strength variations, with some regions experiencing remarkable boosts in signal during the eclipse. These findings highlight how eclipse-induced propagation effects are not the same as those seen during typical sunrise and sunset transitions. The study opens doors for further exploration into whether these effects are symmetrical and how they might relate to ionospheric thinning along specific signal paths. The article ends by asking assistance from DXers to help ID enhanced signals in the 2023 eclipse data sets.
Medium Wave Monitoring During the 2023 Annular Solar Eclipse—Not Just About DXing
By Nick Hall-Patch, VE7DXR
Background
The 14 October 2023 annular solar eclipse was the first one to cross the continental United States since the total eclipse of 17 August 2017. From a DXing standpoint, 2017 was the first eclipse in which there was widespread use of software defined radios (SDRs) to record the entire medium wave (MW) band throughout the duration of the eclipse. Therefore, it was possible to study eclipse receptions after the fact rather more than had been the case during earlier ones. Several IRCA members recorded the 2017 eclipse on their SDRs, and in the months after the eclipse, data files from several locations were examined. It was therefore possible to evaluate the varying signal strength of KSL-1160’s carrier from four different locations in western America, all from outside the path of totality, and to speculate upon the differences in the responses at each site.
That study of KSL’s strength variations during the eclipse led to a presentation at the St. Louis IRCA/NRC convention in 2018, and eventually to an IRCA Technical column (now IRCA Reprint G-096 at http://dxer.ca/images/stories/2019/irca-reprint-index.pdf) which proved to be of interest to HamSCI, an amateur radio citizen science group that had already been using amateur radio communications as a way to study that eclipse’s effects upon the ionosphere. A version of the article appeared on HamSCI’s website and the SDR files referenced by the article were also hosted by the HamSCI community on zenodo.org, along with SDR data from three further locations in eastern America. (Go to zenodo.org, and search on the phrase “Solar Eclipse 2017 recordings” to examine this data for yourself.) Zenodo is a long-term open repository for scholarly work, and these data sets have since been downloaded hundreds of times.
Why would these 2017 SDR files have been of interest to an organization studying radio wave propagation? Unlike the short duration communications found on the amateur radio bands, medium wave (MW) AM broadcasters, assigned between 525 and 1705kHz, provide continuous signals, many for 24 hours a day. Their carrier frequencies are like steady RF beacons. Any changes in that beacon’s amplitude or frequency at a receiver are likely to have been caused by changes in the path between transmitter and receiver. By using suitable hardware and software, either monitoring a single frequency or the entire medium wave broadcast band using SDRs, the resulting files can allow us to characterize the propagation induced changes that these carriers undergo over time, including variations in signal strength and apparent shifts or spreading in the frequency of each carrier. During a solar eclipse, the brief period of darkness along the path of the eclipse can allow AM broadcasters’ signals to temporarily travel much further than they would normally in the daytime, and it is possible to study variations that occur even more quickly than those occurring daily during sunrise and sunset.
Preparation for the 2023 Solar Eclipse
From a DXing standpoint, the 2017 eclipse SDR files were more than functional, but a closer examination revealed gaps in the data, changes of antennas when it suited the DXer, and receivers that had not been properly warmed up, resulting in recorded carriers that appeared to be drifting. From the standpoint of a scientist, this was “found data” requiring judicious handling and compensation. In addition, the data had been transferred many months after the recording had taken place, and sometimes it was no longer clear how the receivers and antennas had been set up for the recording.
Nearly a year before the 2023 eclipse, HamSCI had decided that it would be interested in examining more MW SDR data, but this time asking that the recording of the data be approached in a more professional fashion. In other words, participating DXers would be asked to think a bit more like scientists for the duration of the recordings. Making recorded IQ files of optimum use to propagation researchers would include the following:
- Documenting receiver, software and antenna used, with as many details as possible.
- Not making changes in receiver or antenna configuration during the recording period; if absolutely necessary, recording that change in detail, especially the time that it occurred.
- Warming up the receiver for several hours before recording in order to minimize apparent carrier drift in recorded signals. Better yet, encouraging participants to use SDRs that were locked to a frequency standard such as the Bodnar GPS reference clock, because a frequency locked SDR’s data would display frequencies with stability and accuracy, and allow characterization of any carrier Doppler shifts.
- Making sure that timestamps in their recorded data were as accurate as possible, at a minimum setting the computer clock accurately immediately before recording, and preferably to use a network time protocol (NTP) time client on the computer that would be recording the SDR IQ files.
- Starting recording well before maximum totality in their area, until well after that time; one hour before the start of the partial eclipse to one hour after the end of the partial eclipse were suggested as a minimum.
- If possible, making additional SDR recordings of, for example, the period from two hours before and after sunset and sunrise on the day of the eclipse, and also making a reference recording of the eclipse time period on another day.
Figure 1 shows the path of the 2023 eclipse and the times of maximum obscuration. Efforts were made to involve monitors in both North and South America, and in the end, 13 participants were involved in the experiment, using 14 sites in Canada, the USA, Mexico and Portugal.

Figure 1
- 12 sites also included data from local sunrise (LSR) and/or local sunset (LSS)
- 12 sites also recorded data from the same time as the eclipse period on another date in order to provide a reference of a normal day’s reception conditions
- 6 sites produced data using an SDR locked to a frequency standard that was disciplined using GPS signals. Three of the remaining sites included a signal from a frequency standard in their data recording.
- 10 sites recorded using computers that had their clocks updated using Network Time Protocol (NTP); others set computer time manually
About 10 Terabytes of SDR recordings were submitted for analysis, which is one heck of a lot to poke through in order to find signals fading up and down for a few minutes during the course of the eclipse. Fortunately, it was possible to pre-process all of the files using Carrier Sleuth software which allowed visualization of hours of data at a time from each MW channel, all available to 0.1Hz resolution over an 80Hz span centered on each broadcast channel. It was then a fairly quick process to scan through each of the 117 channels of the AM broadcast band for each data set, searching for unusual carrier enhancements appearing during the eclipse time period.
An example is shown in Figure 2, portraying 1650 kHz as logged during eclipse enhancement in Phoenix, AZ by Burke Baumann KF7NP. The thin lines representing various carriers are represented in “hotter” colors when signal strength increases.

Figure 2
Because Carrier Sleuth can rapidly generate a chart for signal strength vs. time for each individual carrier, it was decided arbitrarily that a carrier that increased in strength by at least 10dB during the duration of the eclipse at that site would be deemed to have been influenced by the passage of the moon’s shadow. By that metric, six sites indeed reported that during the eclipse, different broadcast signals appeared from those normally received in the daytime. However, other sites did not, or received only a few traces of carriers during the eclipse period.
Figure 3 shows the various sites that submitted SDR data, indicated by pale blue circles, and within each circle is the number of AM broadcast band channels on which eclipse effects were noted, even if it was just a carrier.

Figure 3
From Figure 3, it can be seen that locations in Canada’s west and in the south and west of the USA were likely to have been influenced most by the passage of the eclipse. In contrast, it appears that those who were in locations of less than 50% of totality were unlikely to have seen much effect from the passage of the eclipse.
For an example of signal enhancement on the day of the eclipse compared with a normal day, let’s examine data from one participant on one frequency, using Carrier Sleuth. The station carriers on 1520kHz in Figure 4 were recorded near Sacramento, CA on the day before the eclipse by Richard Cook, KE6EE, and include both the time period of the annular eclipse, 1505 to 1743UTC (8:05 AM to 10:43 AM PDT) as well as the ionospherically active period around local sunrise at 1413 UTC (7:13 AM PDT). Figure 4 reveals the normal reception progress from night-time to daytime conditions on medium wave, affecting broadcasters KVEN from the south, and, from the north, KKXA near Seattle, WA, and KGDD in Oregon. Before local sunrise, carriers were shifted and spread out by the effect of the rising sun on the ionosphere, after which, carrier strengths declined rapidly. (KGDD’s apparent rise in signal strength after sunrise was due to it having switched to higher day time power at 1430UT)
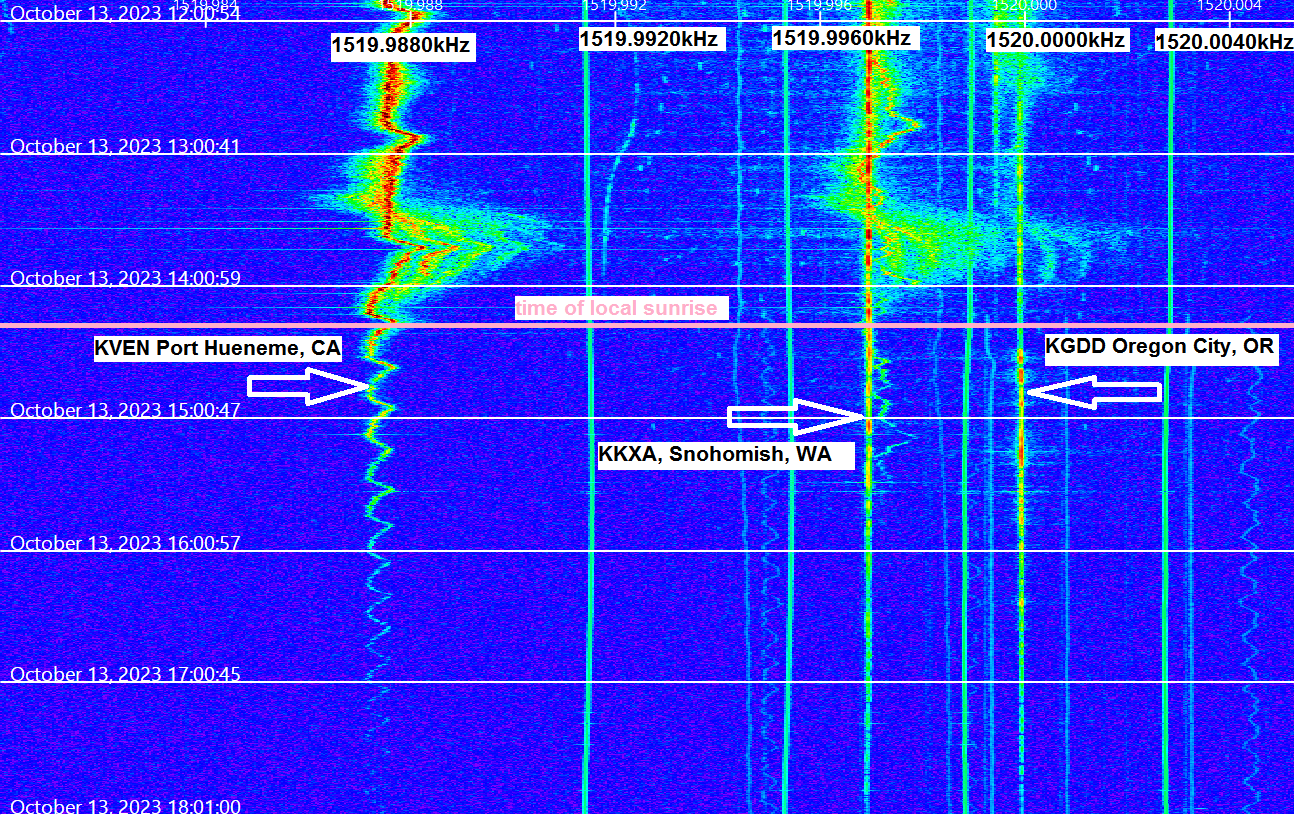
Figure 4 – October 13, 2023
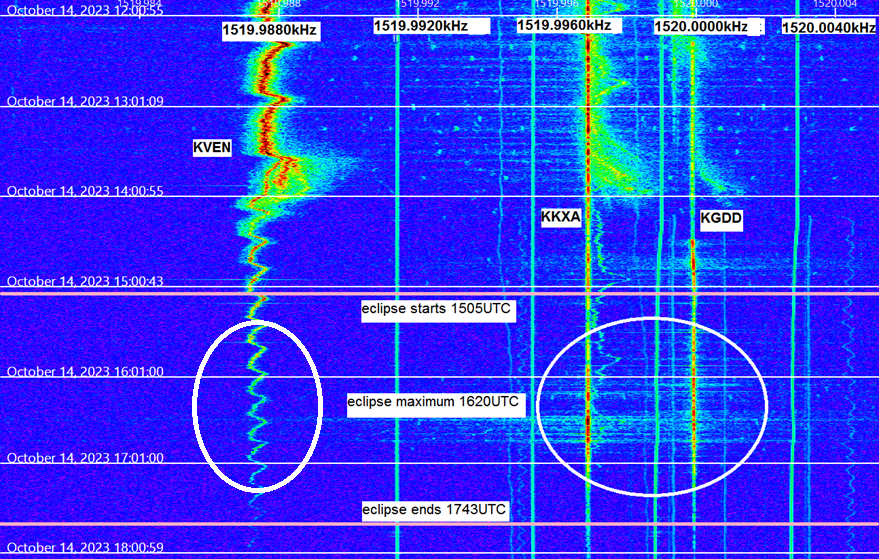
Figure 5 – October 14, 2023
For comparison, in Richard’s recording of 14 October as seen in Figure 5, KKXA and KGDD carrier strengths decrease after local sunrise similar to 13 October, but then increased and decreased again during the course of the eclipse. However, there seemed to be no effect on the carrier strength of KVEN. What could explain the difference? In Figure 6, it can be seen that the KKXA, KGDD transmitters and the KE6EE receiver were all within the 80% obscuration zone, and the paths from transmitters to receiver crossed the path of the eclipse. On the other hand, the path from the KVEN transmitter to the KE6EE receiver did not cross the path of the eclipse, and KVEN was at 70% obscuration. Referencing William Scott’s article concerning the 2024 eclipse, it seems less likely that the percentage of solar obscuration is relevant so much as the fact that the path from Sacramento to Oregon and Washington crosses the path of maximum solar obscuration, and that the D region to the north of Sacramento was thinned enough by the temporary lack of solar radiation to allow a skywave path via the E region. In contrast, the southerly path from KVEN would have had progressively more normal daytime D-region absorption nearer to the transmitter. It is also a shorter path, and it would be interesting to simulate how viable the path would have been anyway with the likely higher elevation angle needed.
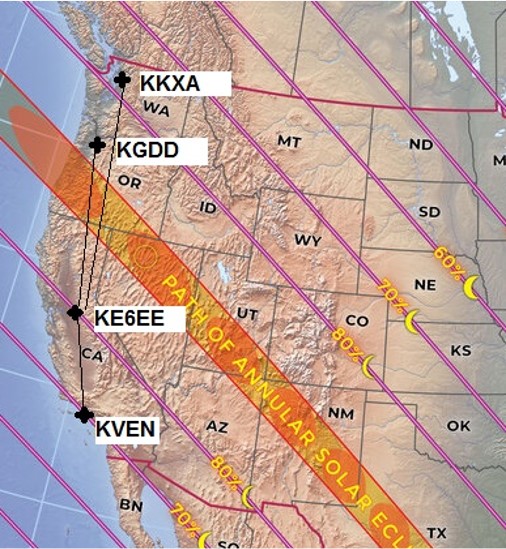
Figure 6 – Transmitter locations relative to KE6EE
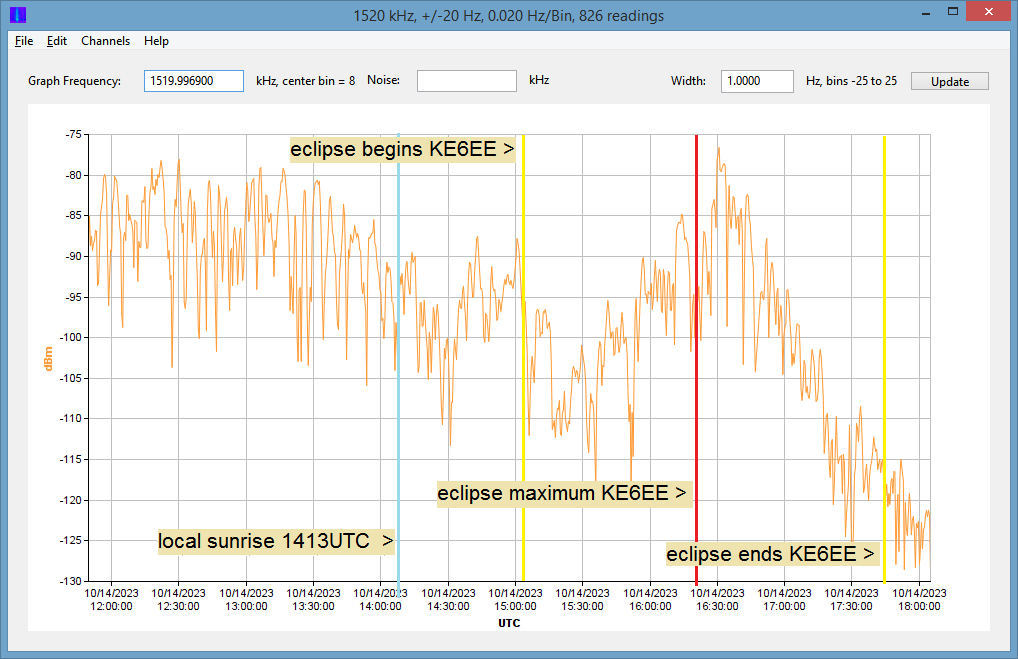
Figure 7 – KKXA-1520 signal strength on October 14, 2023
Let’s look at KKXA’s actual signal strength on the morning of the eclipse by using Carrier Sleuth’s ability to generate a signal strength chart for a specific carrier frequency (Figure 7). A 35dB increase in signal strength was observed, peaking at 1630UT, 10 minutes after the eclipse maximum of 80% obscuration at Sacramento. It will be interesting to see whether that slight time lag in signal strength peaking relative to the eclipse maximum is observed in other data sets, or indeed at other frequencies in this data set, not to mention at other transmitter distances or azimuths from Sacramento.
What science could the Medium Wave SDR data support?
On page 35 of https://hamsci.org/sites/default/files/publications/2022_Hamvention/20220521%20W2NAF%20Booth%20Talk%20Eclipse.pdf, HamSCI had established various scientific questions concerning the 2023 and 2024 eclipses. Two of those objectives might be supported using these SDR recordings:
- How similar was the eclipse’s effect on propagation to that of the daily dawn and dusk terminator passage?
- Is eclipse ionospheric response to the eclipse symmetric with regard to onset and recovery timing?
Comparing eclipse effects to the daily dawn terminator passage
Using the example shown in Figure 5, and zeroing in on only KGDD and KKXA’s carriers (Figure 8) it is easy to see:
- Spectral spreading and some shift of frequencies of both carriers occurred during local sunrise, as well as declining signal strength.
- During the eclipse time period, only the amplitude of the KKXA and KGDD carriers increased and then decreased as the eclipse progressed. There was little evidence of frequency shifting or of spectral spreading, certainly not at the level seen at local sunrise.
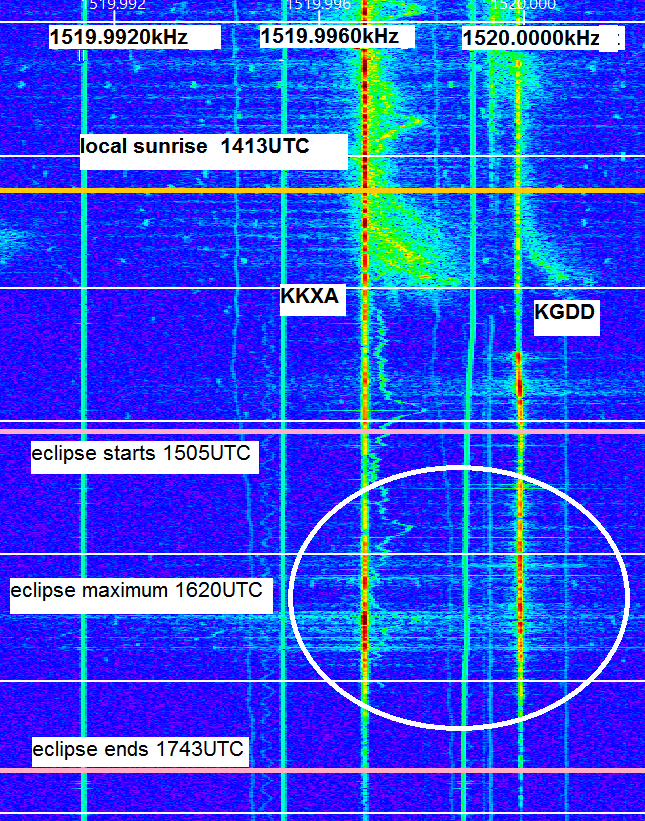
Figure 8 – 1512kHz in Sacramento on October 14, 2023
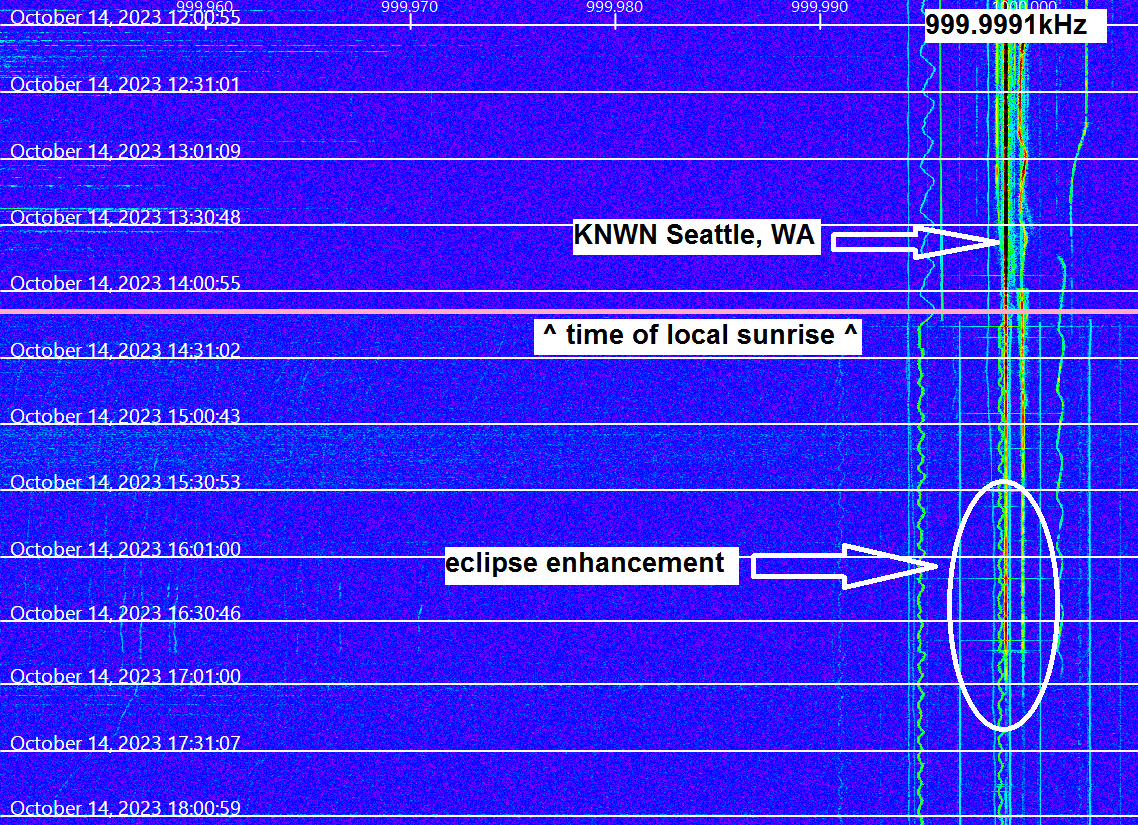
Figure 9 – 1000kHz in Sacramento on October 14, 2023
However, the recording of 1520kHz is just one example, and there are many examples of eclipse-related signal enhancements on other channels, even in this one data set. If we look at 1000kHz (KNWN from Seattle, about 35 miles from KKXA’s transmitter location), then we see very little difference between carrier characteristics during local sunrise, and during the eclipse enhancement period (Figure 9) Close examination of KNWN’s carrier (Figure 10) may show a small amount of spectral spreading during local sunrise, but it is far less than that seen on KKXA’s carrier on 1520kHz. So, at least for the case of 1000kHz, there could be said to be a good deal of similarity between local sunrise’s effects on a broadcast carrier’s apparent stability and eclipse effects on that same carrier, that is, not much effect at all in either case.
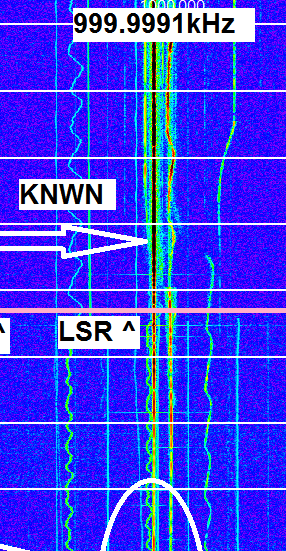
Figure 10 – close-up of KNWN carrier
It must be recognized that the MW broadcast band has a 3:1 frequency span, and comparing receptions on 1000kHz and 1520kHz could be like comparing 20 meter amateur band propagation to 15 meter propagation, or 49 meter shortwave broadcast with 31 meters. So, just examining propagation on one channel and extrapolating what happened there to the entire MW band cannot really be justified. In fact, experienced MW DXers already know that.
Indeed, beyond differences in signal response to the eclipse at differing frequencies, perhaps we also need to think about the angle at which the signal path from the transmitter to the receiver crosses the path of the eclipse, if it crosses the path at all. The same caveat could apply to a signal path relative to the sunrise or sunset terminator. A good ionospheric model should be able to explain what happens at widely spaced frequencies as well as for different azimuths between transmitter and receiver relative to the terminator, or in this case, the path of a solar eclipse.
Is eclipse ionospheric response symmetric with regard to onset and recovery timing?
Visualization, such as shown in the example Carrier Sleuth rendering (Figure 11) can give a rough idea of the rate of increase and decay of the carrier signal strength during the eclipse. Carrier Sleuth can also generate a graph of signal strength vs. time for a quick first look as seen in Figure 7, but that is just a snapshot. The same software can also deliver CSV files of signal strength versus time for a 0.1Hz slice of spectrum, which can then allow us to examine carrier signal strength in earnest, by porting the CSV file into an Excel spreadsheet or other software for further analysis. In Figure 12, you can see a chart created from KE6EE’s raw data for both KNWN-1000kHz, and KKXA-1520kHz.
Just by visual examination, it can be seen that the KNWN-1000 and KKXA-1520 signals display a similar build-up of signal strength but that decay appears more rapid for KNWN’s signal. But, because we now have the numbers available for the signal strength changes versus time in the CSV file, we can calculate the actual rate of build-up and decay. We’ll start with KNWN-1000’s signal alone, zoomed in to show the beginning and end of the enhancement Figure 13. In Excel, it is straightforward to get the slope of this rise in signal strength vs. time, followed by the slope for the decay in strength.
for KNWN:
- slope for increase = 0.26 dB / minute
- slope for decay = -0.87 dB / minute
- ratio of decay in strength to increase = 3.35
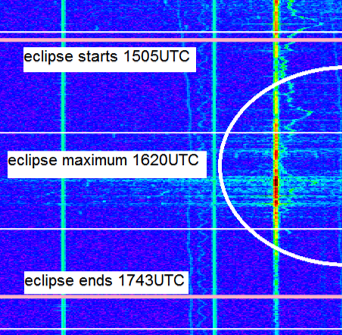
Figure 11 – close-up of KKXA carrier from Figure 7
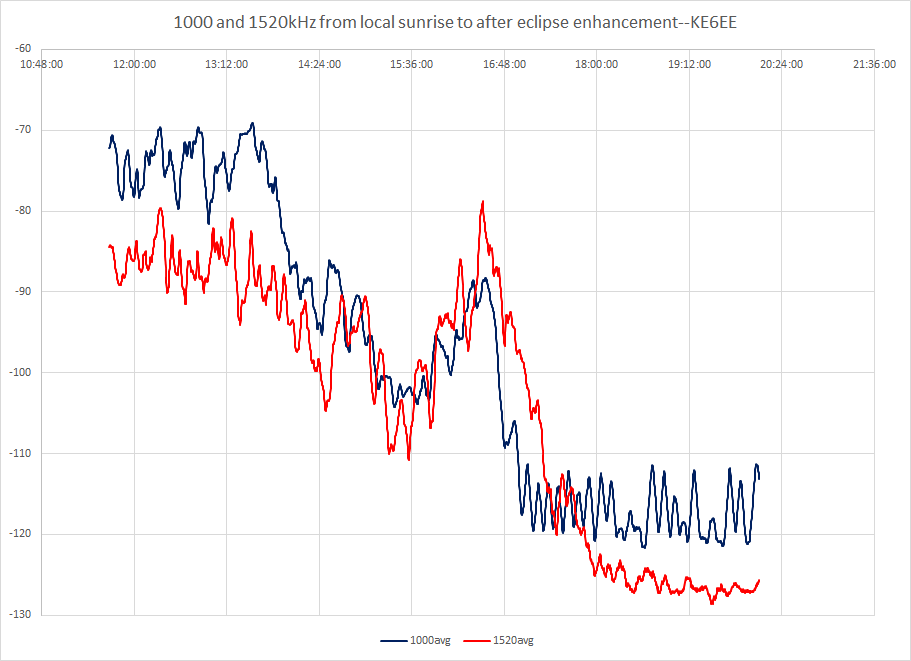
Figure 12 – KNWN-1000 (blue) and KKXA-1520 (red) carrier strength
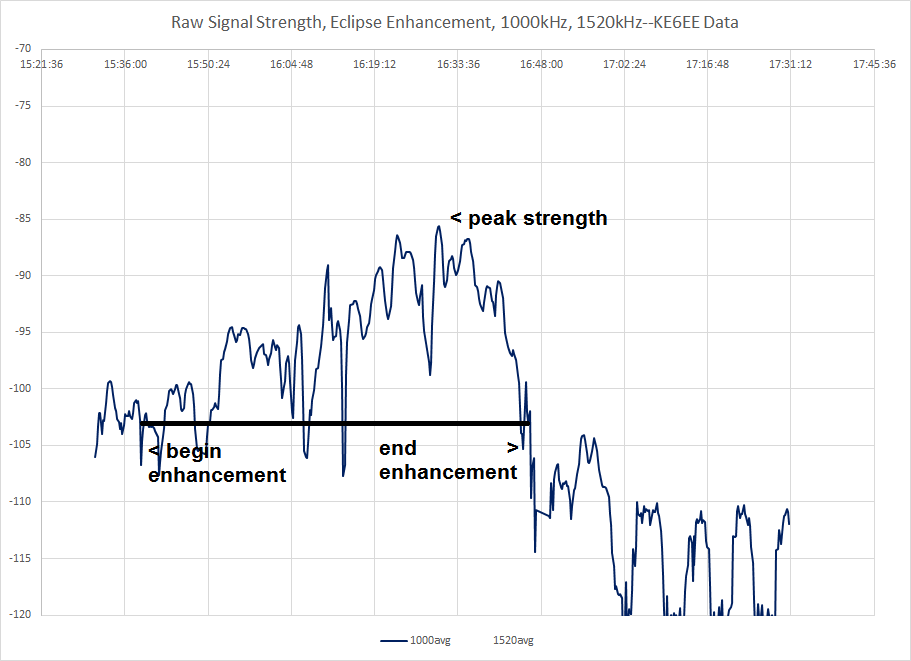
Figure 13 – increase and decay of KNWN-1000 carrier strength
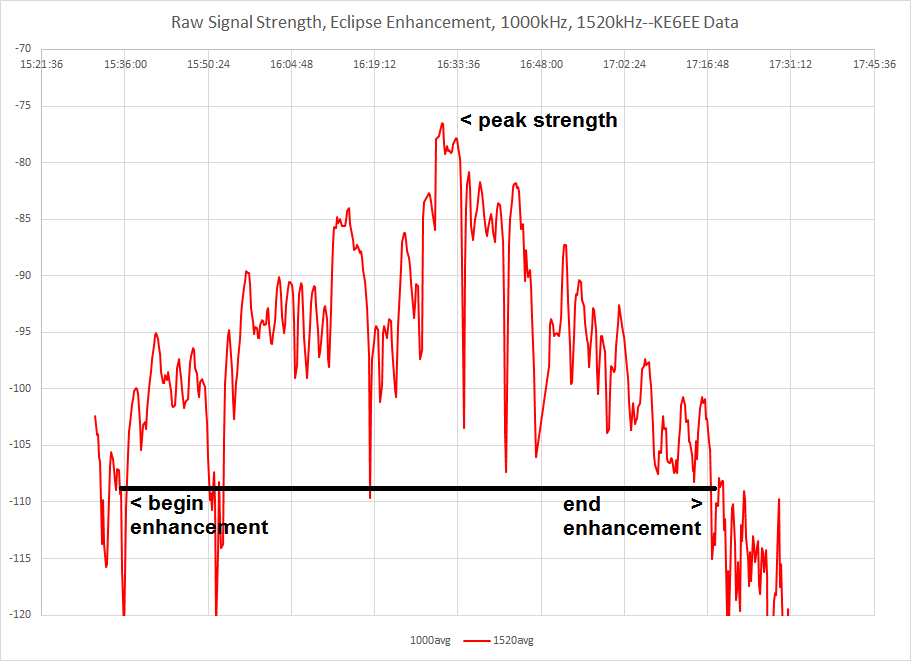
Figure 14 – increase and decay of KKXA-1520 carrier strength
Let’s repeat the exercise for KKXA’s signal on 1520kHz (see Figure 14).:
- slope for increase = 0.31 dB / minute
- slope for decay = -0.56 dB / minute
- ratio of decay in strength to increase = 1.81
The 1000kHz rate of decay of -0.87 dB / minute is considerably greater than the -0.56 dB / minute of 1520kHz. As mentioned, this difference is visible in the comparative graphical representation of the two signals’ strength in Figure 12. Once again, the effects of the eclipse seem to have depended upon the frequency of the received signal.
Of course, that’s from one data set, looking at two received signals of differing frequency, but transmitted from essentially the same location, at least when compared with the distance from Seattle to Sacramento. There were over 400 distinctive enhancements flagged in the fourteen data sets gathered, and these preliminary conclusions have been made by a non-scientist using relatively simple tools and understanding. No effort has yet been made to link any observations with possible ionospheric processes, so there’s a lot more analysis that could be done, and in a more expert fashion.
Data Availability for Researchers and DXers
As mentioned, Medium Wave DXers’ data from the 2017 total solar eclipse have been available for download on Zenodo.org, for examination by both amateurs and professionals. Similarly, the 2023 data, or at least those SDR recordings that showed eclipse effects, are also now available online, as are the results of the Carrier Sleuth processing of every participant’s complete data set, whether they detected eclipse enhancements or not. Supporting information and programs needed to help figure out what was being heard are available at zenodo.org as well. The index for all the 2023 data sets, including links to them, can be found at https://zenodo.org/records/14166439 .
Please note: If the data is used for research, cited in an article, paper, poster or presentation, the participants would expect and appreciate the courtesy of receiving credit for their work. Questions regarding attribution should be directed to HamSCI, via e-mail.
Conclusion: What Is Next?
Having partially titled this article “Not Just About DXing”, it must be noted that it still could be about DXing, because it may not be the best use of scientists’ time to ask them to identify the various stations that were enhanced during the eclipse when DXers have far more experience in doing exactly that….so this is a call asking DXers to help ID some stations in these data sets. So far, that has only seriously been done on the data set from Victoria, BC, so there is plenty of scope.
A reasonably swift approach seems to be to download a Carrier Sleuth FFT file for a likely site from Zenodo, and examine the individual channels for signal enhancements during the time of the eclipse. Once a strongly enhanced carrier has been identified on a specific frequency, download and play back the IQ recordings for that time period, looking for identifiable information in any audio heard, just DXing in other words. When various signals have been identified in a specific data set, please send that logging information to HamSCI . Use your DXing talents to the fullest, as many of these signals lasted only for a few minutes, and there was not often the luxury of that enhancement occurring at the top of the hour. One technique that may be helpful is to examine other eclipse data sets from Zenodo that could contain the same audio, but as a regular daytime signal that may be identifiable. If the data set was from an SDR that is documented to have been locked to an external frequency reference, please note the logging’s frequency offset read out from Carrier Sleuth as well. The more information, the better.
And, just in case that isn’t enough about eclipses and radio and the data thereof, a similar work is in progress on the 2024 total eclipse SDR recordings as well.
(with thanks to the HamSCI 2023 eclipse Medium Wave Recordings Event participants: Carlos Nascimento, CT7AUS; Burke Baumann, KF7NP; Richard Cook, K6EEE; Nigel Pimblett, VE6TNF; Mark Whittington, AG5RT; Manuel F. Caballero, XE2NNS; James Niven; Mike Boice, KW1ND; Tim Tromp, KE8JFM; Bill Whitacre; John Glover, W2QL; John Ciccoletta, N3BE. Also, thanks to Jeroen Bet for proofreading and summary suggestions.)
(This first appeared in IRCA’s DX Monitor and is used with permission. See https://www.ircaonline.org/default.php for club details. The article was based on talks given at HamSCI Workshops in 2023 and 2024; more details can be found at https://hamsci.org/hamsci2023 and https://hamsci.org/hamsci2024 .)
reply to Art Jackson
Thank you for your analysis of the article and of HamSCI’s work.
Indeed you are correct that the first order effect of a solar eclipse on MW reception is that distant signals increase and then decrease with the passage of the eclipse. If one is concerned only with first order effects, that observation has been well known for a hundred years, dating back at least to the Scientific American study (https://www.jstor.org/stable/24978869 ) using, incidentally, citizen scientist inputs, the HamSCI of its day.
The recorded data from SDRs can now show that process in much finer detail, both in time and from multiple directions at the same time. The present studies were intended, among other things, to validate a reference ionosphere designed specifically for solar eclipses, so this amount of detail will be a useful challenge to that model.
Have you thought of making a presentation about your thoughts to HamSCI via their weekly Telecons: https://hamsci.org/node/44 , and see if they can address your concerns? I am sure that they would be of interest, especially the hypothesis that eclipse effects are pretty much the same as sunrise and sunset effects, when the article to which you’ve affixed your comment uses actual data to show something different. Admittedly, only two instances on one frequency were described there, but how many instances are needed to disprove an hypothesis? HamSCI has gathered plenty of medium wave and other data from two different eclipses, so there should be plenty of opportunity to discover other instances. Or not, as the case may be. Perhaps you could assist in that research? The data is freely available.
Once again, thank you for your comment, and please don’t pass up the opportunity to air your concerns with HamSCI.
Well, my participation with that event did get me into a new radio hobby, AMDXing.
To me it was worth it.
Rich Cook
KE6EE
First of all, I am not a “Debbie Downer”.
I have been a Radio DX enthusiast for well over 60 years. I have been an active Amateur Radio Operator for 46 years. I have always operated with the intent of doing a lot with a little. My DX operating has always been modest. I have only borrowed money once in my lifetime for anything involved with this Hobby. I have always strived to understand propagation. I owe my success to that alone.
I have spent most of my radio experience reading about, observing, documenting and conducting studies usually within the principles of the Central Limit Theory of Statistics. In other words, if you can’t chart it and apply principles used in Statistics over a period of time, it isn’t worth the paper or computer it was written on.
I have published two papers for VHF Society Conferences as well as numerous presentations for clubs, conventions and conferences for the last 40 years. By the way, I am a retired Math Teacher.
Solar Eclipses are special events that occur in a specific areas over many many years. They don’t happened day to day, week to week, month to month, year to year and/or Solar Cycle to Solar Cycle. In my 73 years, I have experienced one Total (last year) and three other partial Solar Eclipses that were between 85-95% coverage. So my question is;
Is there anything really useful presented towards something that rarely happens?
Ironic is that we see the same condition when the Sun sets and in reverse when the Sun rises.
When I heard HAMSCI was asking for participation in the Solar Eclipse, I rolled my eyes. What articles and papers completed by them hasn’t really shown me anything learned, some plagiarized and some expounding of Theories long disproven or what I call Witch Doctor Science.
In boredom amongst my love of Hamming, I decided to “play” during the Total Eclipse April 8, 2024. I was blessed to live in an area that experienced an absolutely fabulous phenomena. Bucket List item checked off. I live 100 yards from a lakefront, with great views to the Horizon.
While I was out enjoying the awesome event, my $25 RTL-SDR was hooked into a killer 3-Foot PVC Box Loop pointed parallel to the Eclipse. Using HDSDR software, I recorded a less crowded part of the Medium Wave spectrum. I also recorded the same spectrum a couple of days before so I could compare results. Like this study shown, I plotted/charted a few area Medium Wave outlet signals prior to the arrival, the beginning of, during the Total and through the end of the Eclipse.
After plotting and analyzing the Data, guess what was discovered? Not a dang thing.
As the Sun starts to disappear, the noise floor drops slightly and the signal level decreases. Peak signal levels occur during Total and decline once the sun reappears. The only thing that caught my attention was that the Medium Wave outlets to my northeast (direction past my peak), the signals dropped off at slower rate than they increased prior to my peak. Same stuff happens each Sunset and later the Sunrise.
Overall , nothing learned. When you do this part of the hobby, it is all about the Sun, the time of the day, the time of the year and finally the amount of Solar Activity from the Sun. There have been many before us that have developed computer programs, published books and do seminars on Propagation to answer your questions. A Paper on a single rare event may raise your curiosity, but doesn’t answer the important topics.
Have fun. Stay curious though.
73 Art K7DWI
Fantastic informative read. Thanks for all the effort!