by Satoshi Miyauchi, JP1SCQ, with Nick Hall-Patch, VE7DXR
Introduction
In early November 2025, several members of our Totsuka DXers Circle in Japan (TDXC https://www.tdxc.net/abouttdxc/ ) traveled from the Tokyo area to Tanohata village in Iwate prefecture on northern Honshu island in order to take part in a medium wave (MW) DXpedition that took place on the 8th and 9th of the month. The site was about 500m (1/3 mile) from the Pacific Ocean, overlooking Kitayamazaki cliffs, a very scenic area (Figure 1), but also one from which a great deal of long-haul DX had been heard in the past, including trans-polar WBZ-1030kHz, as well as the farthest possible Antipodes DX such as R. Nacional in Argentina on 870kHz and Radio Monte Carlo in Uruguay on 930kHz.

Figure 1
Our listening post was a meeting room in the Tanohata Nature Training Center, where we set up our receivers, such as Perseus and Airspy HF+discovery, plus our recording gear and accessories (Figure 2).
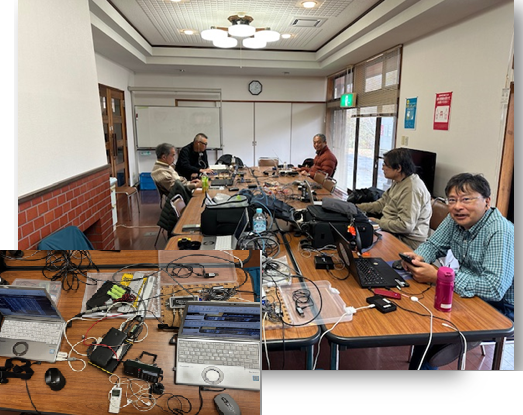
Figure 2
My recording software was SDR Console, but playback and analysis also used WavViewDX. We set up a TDDF (Twisted Double Delta Flag) antenna with a northeast directional pattern in order to receive medium-wave broadcasts from North America. (Figure 3)
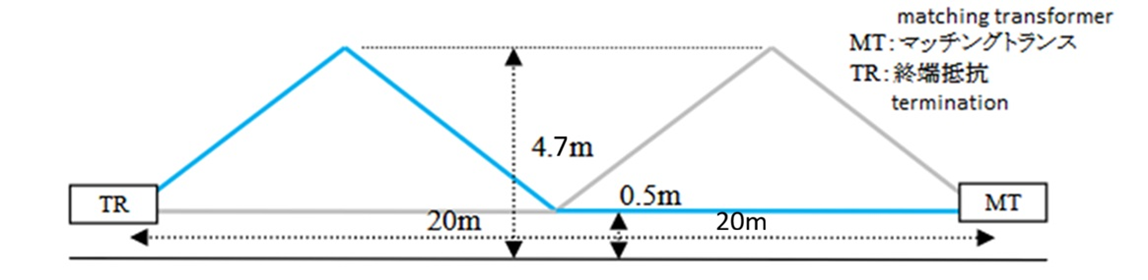
Figure 3 – TDDF antenna; note that low-noise pre-amplifier with bias-T is a must.
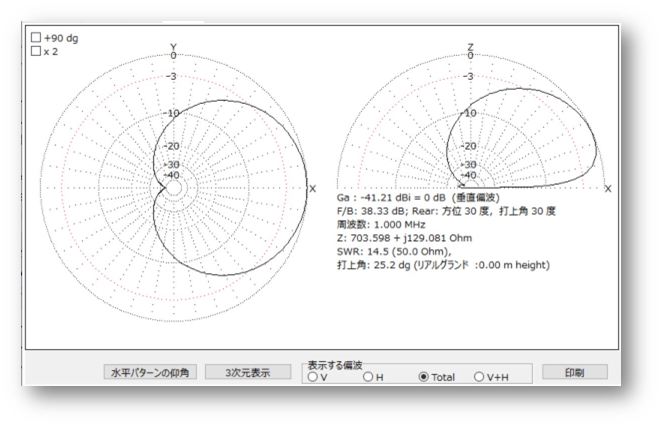
Directional patterns from Kazu GOSUI
On the second evening, November 9th, while enjoying the reception, an emergency earthquake alert was issued, and shaking struck. Inside our building, nearly 200 meters above sea level on the solid bedrock of Kitayamazaki, the shaking felt less intense than the reported magnitude of 6.9, even with an epicenter only 140km away. (Figure 4)
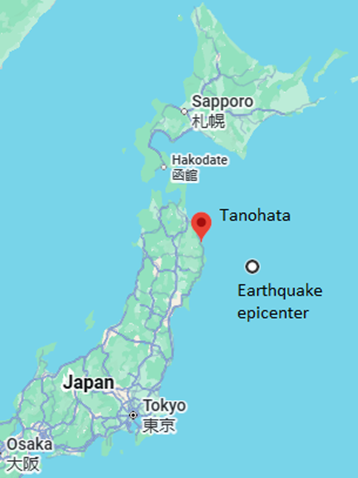
Figure 4
However, since earthquakes had been occurring even before that day and numerous aftershocks were felt afterward, it left us with a vague sense of unease. Later, a tsunami advisory was announced on the radio, plus the Tohoku Shinkansen train back to Tokyo had also stopped, and I myself couldn’t help worrying about whether it might affect my return home the following day. At that moment, I had a conversation with the members there, thinking, “If there’s something related to the earthquake recorded, that would be amazing.” However, during the real-time reception, we were targeting signals from North America in 10kHz steps, and there was no effect noticed upon those receptions.
Unusual Signal Dropouts Observed
I played back the SDR files using WavViewDX (https://rweiss.de/dxer/tools.html), a software with many capabilities, including a choice of displaying all signals across the MW band at 9 or 10kHz channel spacing, but, because I was looking for North American DX, I only realized a week after returning home that the reception conditions for the 9kHz spaced domestic Japanese stations had significantly changed around 0715 to 0745UT (16:15 to 16:45 Japan time) on 9 November, based on our recordings. The dropouts on various channels over 0715 to 0745UT are quite obvious in Figure 5; I had never seen such sudden attenuation before. For those not familiar with WavViewDX, the green vertical lines on the display represent stronger signals being received on broadcast channels, while gray or black areas represent weak or no signal. (For a more detailed description of WavViewDX and its capabilities, see https://swling.com/blog/2025/10/an-introduction-to-wavviewdx-sdr-playback-software-a-totsuka-dxers-circle-article-by-kazu-gosui
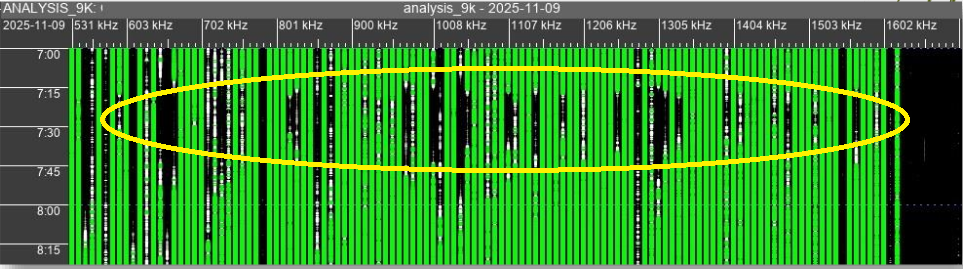
Figure 5 – WavViewDX display of signal dropouts. X-axis is frequency of received signal, Y-axis is time UTC
A first look at the data led to a couple of other observations:
- Signals originating north of the receiving site, primarily from the island of Hokkaido, were largely unaffected by the attenuation. (It is true that our antenna’s directionality was northeast, but it also received the stronger domestic stations from southwest of the antenna.)
- Regarding signals from North America, even during the same time period, the intense attenuation observed in domestic stations was generally not seen. It is unclear, however, whether some dips in North American signals around that time were due to normal fading or to the same cause that brought about the attenuation in domestic stations.
What Could Have Caused These Dropouts?
Local sunset?
These sudden drops in signal strength corresponded quite closely with local sunset at 0722UT, normally a time of disturbed propagation (see Figure 6), so the most straightforward possibility is simply the well-known change in ionospheric propagation conditions that occurs at sunset. Was that all that there was to it? However, we had been listening and recording the previous day as well, and analyzing those recordings with WavViewDX yielded no sign of dropouts in domestic signal strength at sunset on that day. Examining recordings that had been made at the same site, using similar equipment, on 24 October 2024, also showed no dropouts taking place at local sunset.
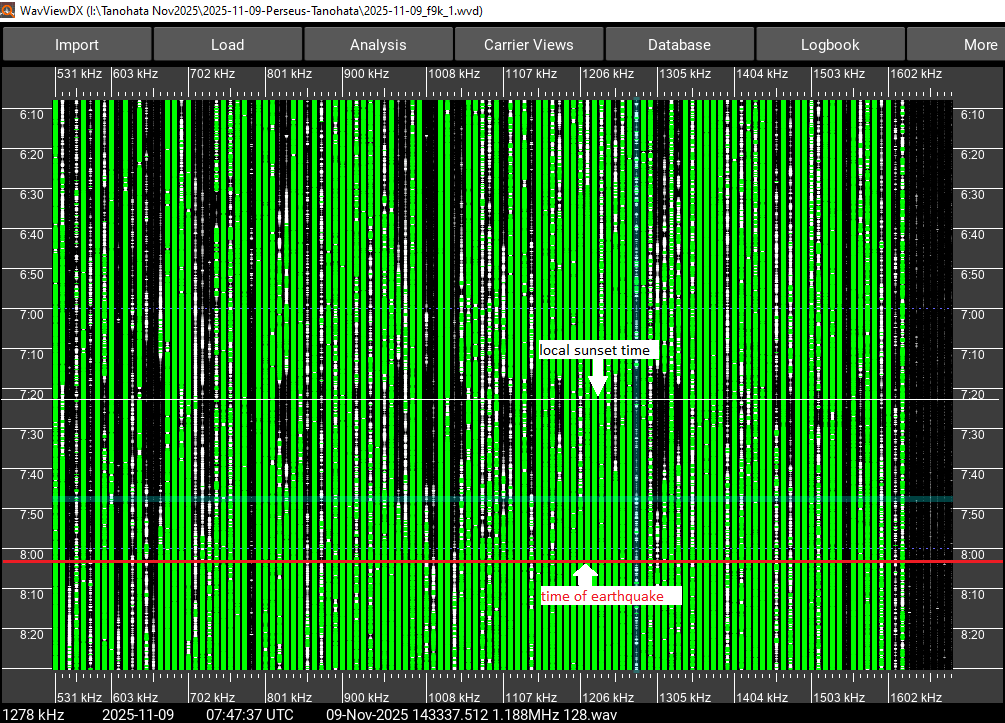
Figure 6
In fact, over many years in Japan, not only at this location but across various areas, records have been accumulated during the same time window, because good trans-Pacific DX occurs around local sunset. Nowhere in these records has a situation such as observed this time—a significant attenuation of domestic stations at local sunset—been found. Therefore, it seemed unlikely that sunset was the cause of the dropouts, but what else could it have been?
The earthquake?
What about the occurrence of the large earthquake at 0803UT, also noted in Figure 6, which was within the hour after the observed attenuation events? Although there have been reports of changes in very low frequency (VLF) signals and noise before earthquakes, we had not heard of signal strength precursors having been observed at medium frequencies. That caused us to look more closely at which signals were actually getting attenuated.
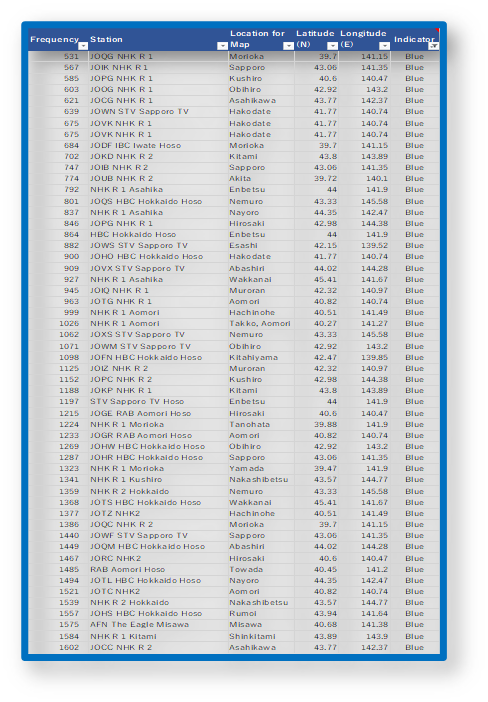
Table 1
First, we’ve listed domestic Japanese stations that experienced significant attenuation during the 0700-0800UT period, as well as those with almost no change, representing them as RED (attenuation present) in Table 2 and BLUE (attenuation absent) in Table 1.
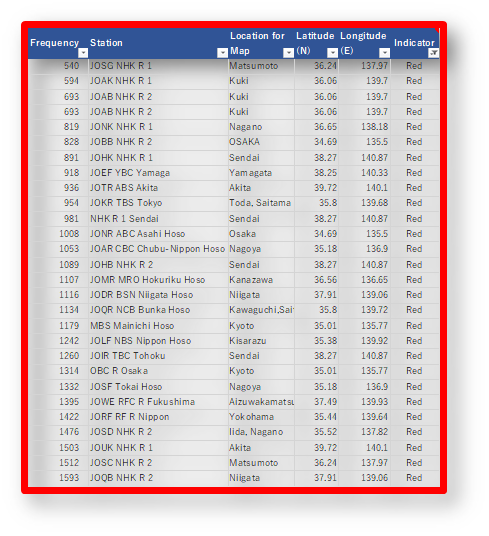
Table 2
Significant attenuation was observed for nearly all signals from stations south of a line drawn between Akita in the northwest of Honshu and our site at Tanohata in the northeast. In contrast, stations where no severe attenuation was observed were those north of the receiving location, specifically from the northern tip of Honshu to the Sea of Japan. These were mainly stations from various locations across Hokkaido. The two areas are represented by the red and blue circles in Figure 7. In addition, a number of signals from the northeastern portion of the People’s Republic of China also suffered attenuation at about the same time as signals were attenuated in southern Japan. (Table 3).
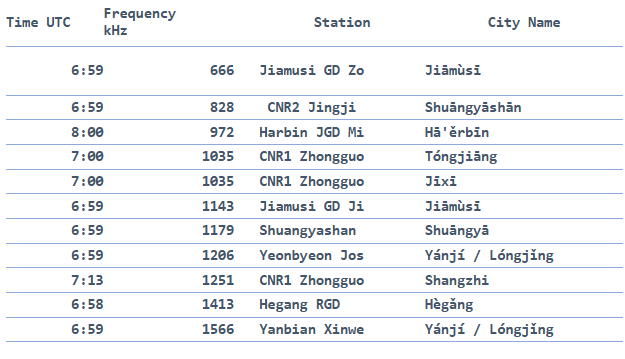
Table 3
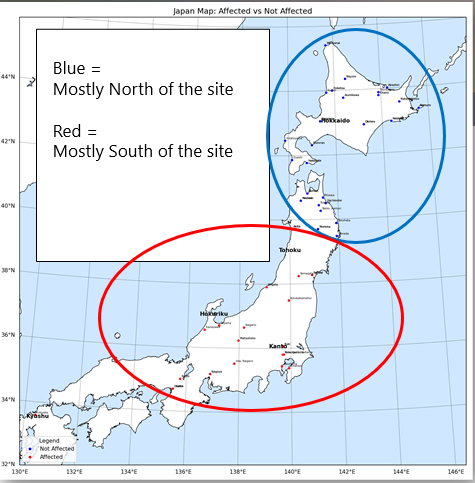
Figure 7
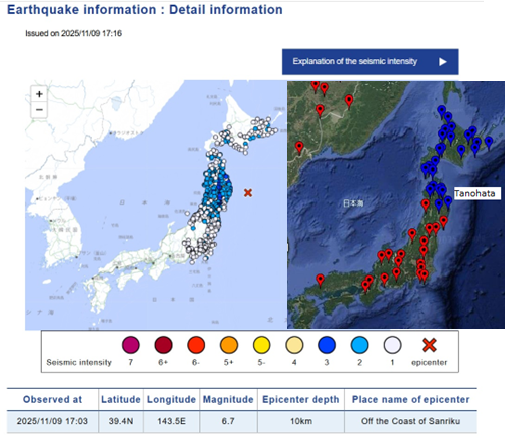
Figure 8
We have noted that the attenuation in signal strengths occurred before the earthquake. But the only easily available data about the earthquake’s effects on Japan’s land mass were from various seismographic records at the time of the earthquake itself. So, we started with those records, portrayed on a map in Figure 8), alongside a similar Google map of Japan with pins indicating effects on signal strength (red pins for attenuated signals and blue pins for unaffected signals). Was there at least some correlation between the intensity of the earthquake at various sites and the sites of observed attenuation? The earthquake was felt less strongly in areas further to the north of the receiving site, and signals were not attenuated from there. However, the earthquake was not felt particularly strongly further south in Japan, and signals from that part of the country had definitely been attenuated. Perhaps before we started looking for seismographic datasets from before the earthquake occurred, we should look for some more obvious cause of the signal drop-outs that we had missed?
Further signal analysis
So, we looked more closely at the strength of the attenuations relative to the locations of the transmitter sites. In fact, it was found that more distant signals from the south of Japan and from northeast China were attenuated even more than signals nearer the earthquake epicenter.
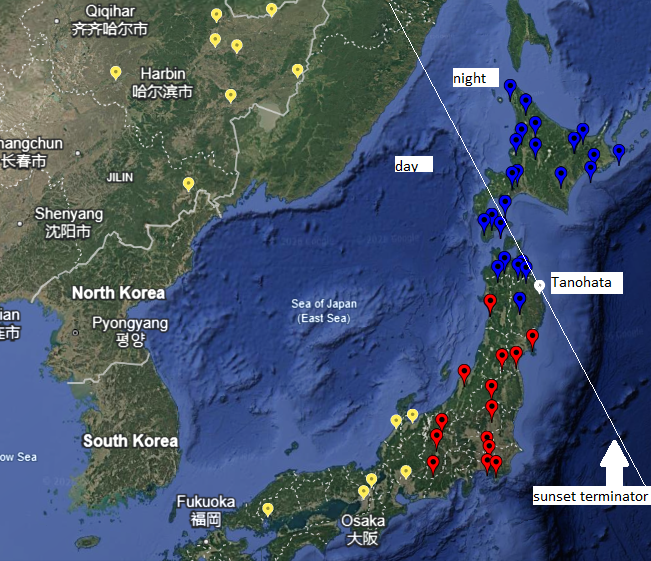
Figure 9
Figure 9 based on Google Maps shows this clearly, where the yellow pins indicate greater than 25dB declines in signal strength from various transmitter sites during the attenuation event, while the red pins indicate signal attenuations of less than 25dB.
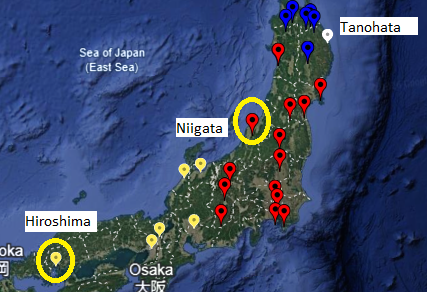
Figure 10
To illustrate more clearly the difference in the characteristics of the attenuation observed in signals received in these two categories, we chose receptions from JOER-1350kHz in Hiroshima, at 1040 km from Tanohata, and JODR-1116kHz in Niigata at 340 km away (Figure 10). We then created graphical representations of the signal strength variations in those receptions, as seen in Figure 11, using Carrier Sleuth’s signal strength extraction capabilities (https://www.blackcatsystems.com/software/medium_wave_carrier_display_app.html). On JODR’s chart, we have also superimposed the signal strength of a nearby relay of Japan’s NHK 1 network (now NHK AM) on 1224kHz.
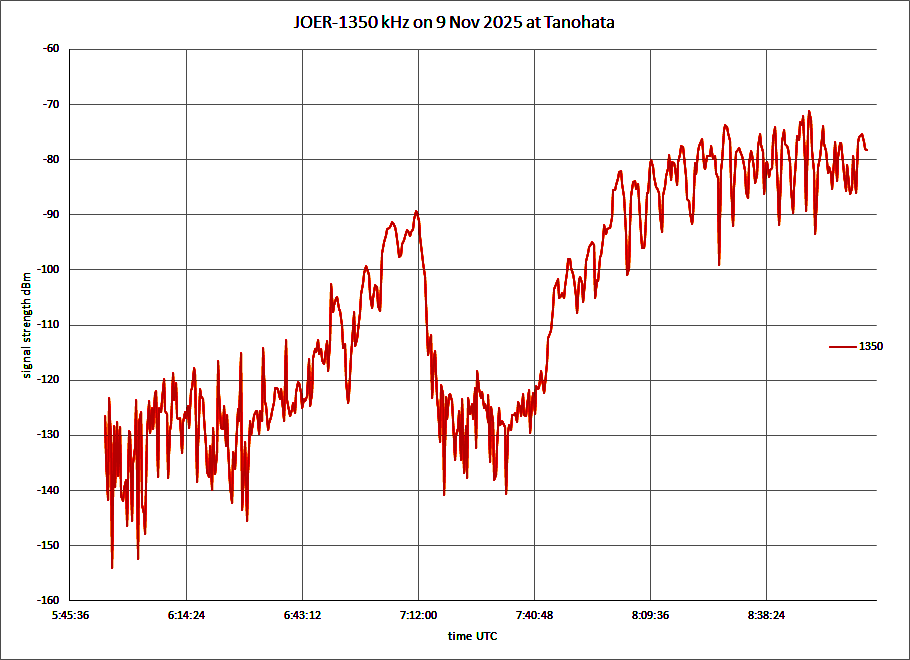
Figure 11 – Signal strengths JOER-1350kHz (red trace), JODR-1116kHz (blue trace), and NHK1-1224kHz (purple trace)
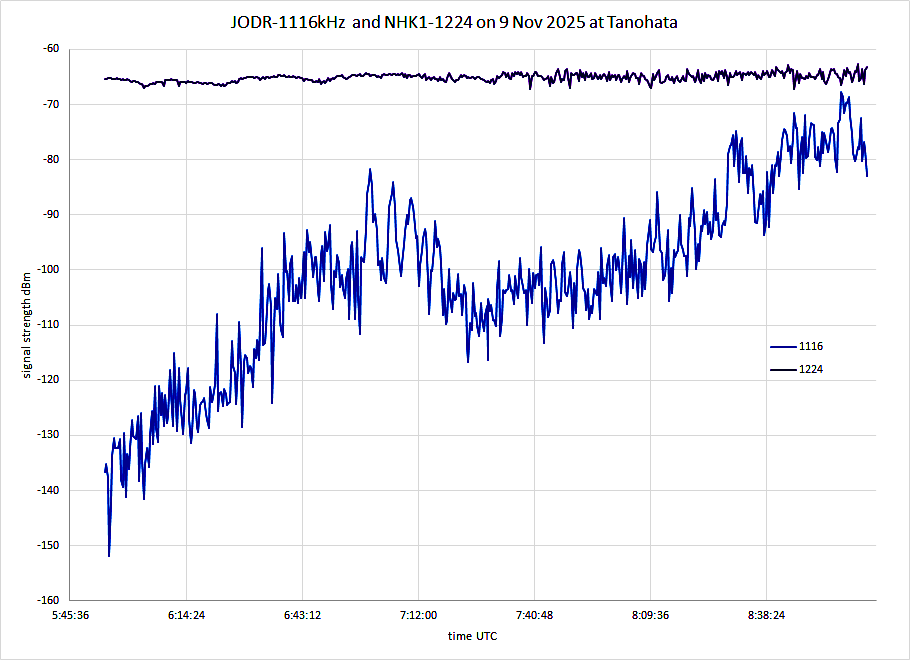
There was much deeper attenuation of the more distant JOER’s signal compared with that from JODR’s closer transmitter. These attenuations took place during the normal increase in signal strength from distant MW transmitters that occurs as sunset approaches, indicating that these two signals were almost certainly skywave, not ground wave. In comparison, the signal on 1224kHz from 5km away was almost certainly ground wave only, and showed little change in signal strength as sunset approached, nor did it show any sign of the attenuation observed on JOER and JODR’s signals. It seems likely then that the attenuations observed were a skywave phenomenon, yet the skywave signals from north of Tanohata were unaffected.
Perhaps the position of the sunset terminator was more important than the time of the earthquake after all; we’ve indicated the sunset terminator in Figure 9 as it passed through Tanohata at 0722UT on 9 November, a few minutes after the attenuation event began. These points are clear:
- The unaffected signals tended to be on the nighttime side of the terminator
- The affected signals were on the daytime side.
- The more deeply affected signals were further away from the receiver on the daytime side.
What event would influence the propagation of medium wave signals from the daytime side of the terminator, but not the nighttime side? And why would more distant signals on the daylight side of the terminator be attenuated more? What phenomenon is known to affect skywave propagation during the daytime, but not at night? Could there have been a solar flare?
Had there been a solar flare?
In fact, there had been an X1.7 solar flare that peaked at 0735UT on 9 November. It was reported by NCIT, Japan’s National Institute of Information and Communication, as well as by NOAA. In addition, NCIT had created a detailed report (https://swc.nict.go.jp/report/topics/202511121600.html) concerning that solar flare. Unfortunately, that particular web page is in Japanese only, but many browsers now include a translation engine. This report stated: “Ionospheric observation by ionosonde (Okinawa, Oogimi), The disappearance of the ionospheric echo in the area indicated by the white circle can be confirmed“. The ionograms at 0710 and 0735UTC from that report are reproduced here in Figure 12. Okinawa was in the sunlit area throughout the period, and the echoes below 5MHz from the ionospheric sounder used at that site disappeared completely between the two observations. This report said that this had been a “Dellinger Phenomenon” observed in Okinawa—which is better known in America as a “radio blackout”. A shorter report on the NCIT site indicated that “Due to this flare, the SWF were observed in Yamagawa (Kagoshima) and Ogimi (Okinawa) at 07:30 UT on 9 Nov.” “SWF” refers to a “shortwave fadeout”.
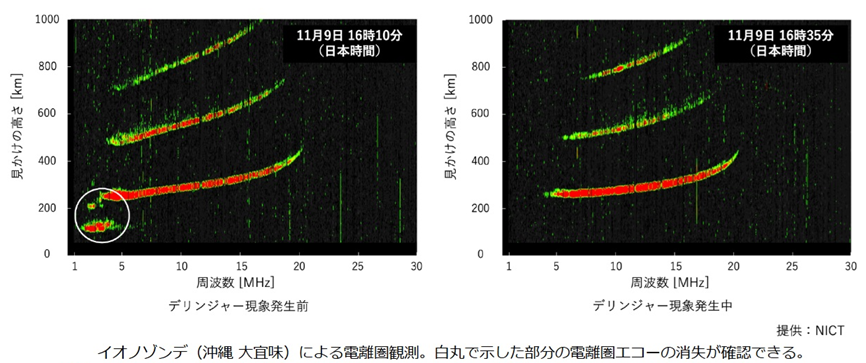
Figure 12 – Difference in ionosonde echoes from NCIT’s Okinawa site on 9 November 2025—on the left at 0710UT, on the right 0735UT
Did this mechanism explain the observed attenuations?
A shortwave fadeout is caused when X-rays from a solar flare further increase the ionization of the D-region of the ionosphere, which normally has already been ionized enough by other daytime solar radiation to absorb any skywave propagation below about 3MHz. This additional D-region ionization then blocks higher frequency skywaves, suppressing shortwave signals that would otherwise propagate perfectly well on a normal day. Simulations of D-region absorption can be viewed in SWPC’s “D-Region Absorption Product (D-RAP)” model (https://www.swpc.noaa.gov/products/d-region-absorption-predictions-d-rap), which uses a heat map to portray the impact of the D-region on skywave propagation at various frequencies. On a normal day, the effect of the D-region on propagation of frequencies below 10MHz in the daytime is represented by a pale violet to pale blue color in the heat map, such as seen in Figure 13. In contrast, the increased absorption in the D-region due to solar X-rays during the peak intensity of the solar flare on 9 November in Figure 14 is conveyed by the bright coloration of the heat map, indicating that frequencies above 25MHz were being affected under the solar zenith point by that event.
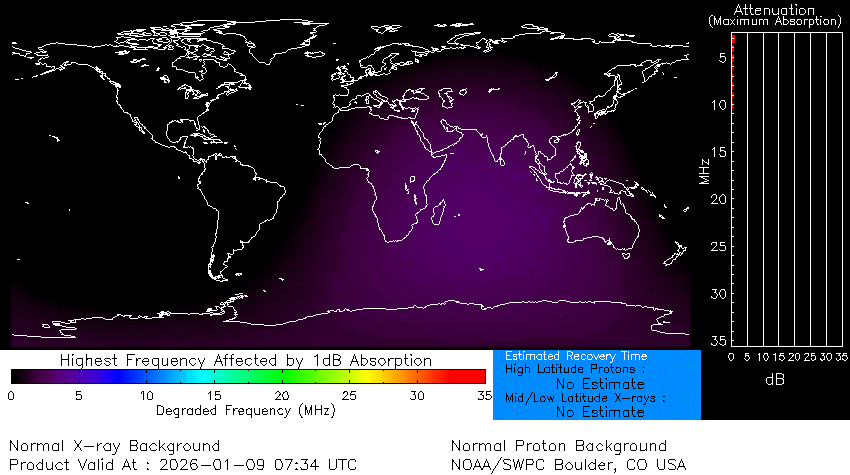
Figure 13 – D-RAP normal day
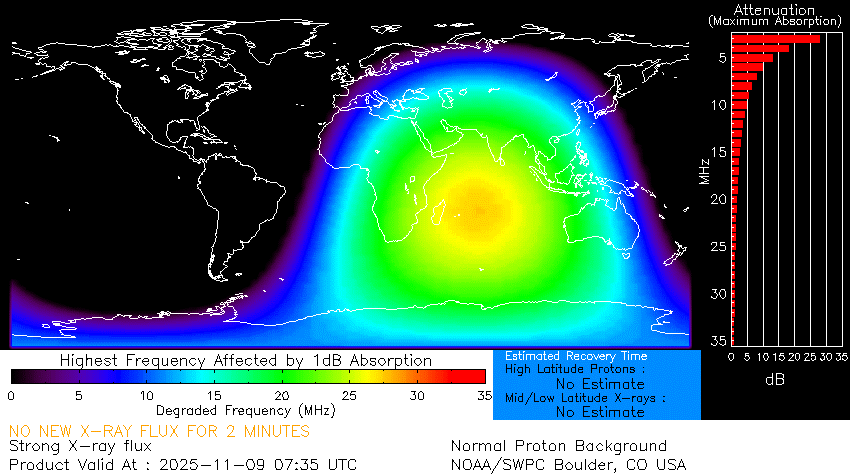
Figure 14 – D-RAP X1.7 solar flare
Why should there have been any effect at medium waves from this particular solar flare? Normally, a medium wave DXer would never notice the effect of a flare because medium wave skywave would have already been suppressed by the usual daytime D-region ionization. In reality, as medium wave DXers know, in the hours before sunset and after sunrise, there is a less dense D-region due to lower intensity solar illumination at those times, particularly in the months around the winter solstice in temperate regions. That’s why, at local sunset, our DXers at Tanohata were not surprised to be receiving “sunset skip”, signals from the parts of Japan and China that were still in daylight.
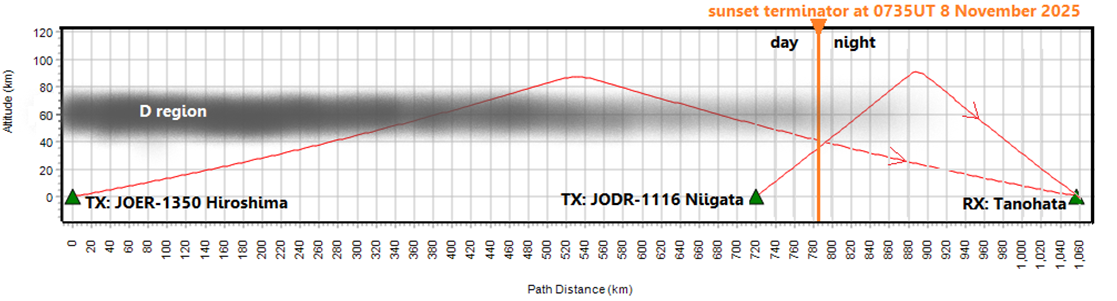
Figure 15 – simulated paths 8 November 2025
In Figure 15, we put together a graphical representation of the paths from JOER-1350’s and JODR-1116’s transmitters to the receivers at Tanohata, based on Proplab Pro’s (https://shop.spacew.com/index.php/product/proplab-pro-hf-radio-propagation-laboratory/) simulated ray tracing of skywave refractions off the ionosphere’s E-layer. We added our own rather speculative rendering of the D-region, becoming progressively less dense the closer the paths got to the sunset terminator. This thinning of the D-region allows signals to propagate by skywave from the daytime side of the terminator despite the D-region still being somewhat energized by the remaining low-angle sunlight later in the day.
Using details from the D-RAP model graphics, which are archived at https://data.ngdc.noaa.gov/earth-science-services/models/space-weather/drap/, we created the depictions in Figure 16 for both 8 and 9 November 2025 at 0735UT, the time of maximum effect from the solar flare on 9 November. 8 November was a normal day, with D-region absorption near the terminator at 0735UT determined by waning solar radiation as sunset approached, pretty much as portrayed in Figure 15. The model for 9 November 2025 at that time shows considerably more D-region absorption over southwestern Japan due to the solar flare, even at the point where sunset occurred at 0735UT.
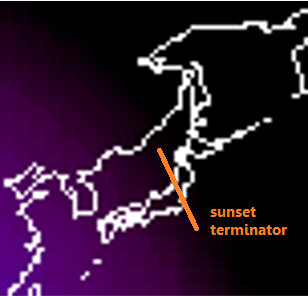

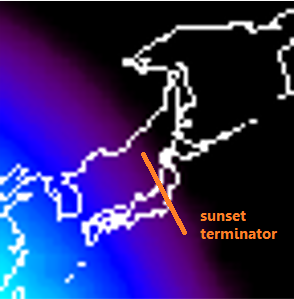

Figure 16 – detail of D-RAP simulations, 8 and 9 November 2025
It looks as if X-rays from this major solar flare on 9 November had more intensely ionized the normally less dense D-region near the sunset terminator seen in Figure 15, so that the D-region might have been more like that illustrated in Figure 17.
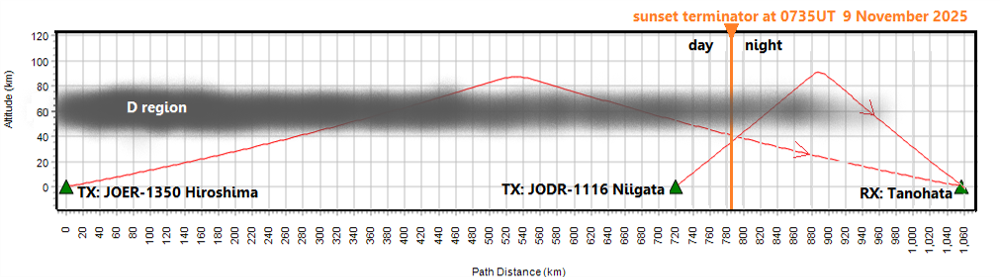
Figure 17
Therefore, signals propagating from the sunlit side of the terminator, such as from JOER and JODR, would have suffered greater absorption, at least for the duration of the flare. This absorption would have happened quite suddenly, as the X-ray intensity from the solar flare increased markedly within a few minutes.
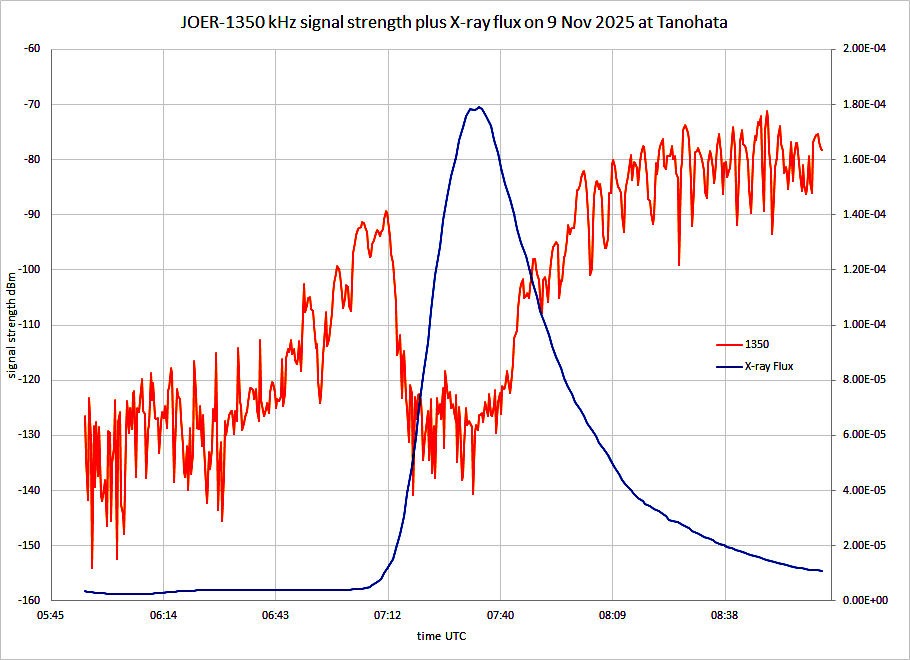
Figure 18
Indeed, as noted in Figure 18, JOER-1350’s signal from Hiroshima declined by over 30dB in five minutes at the receiver in Tanohata, and that signal decline mapped very nicely with the rapid increase of the X-ray flux from the solar flare, which is shown as a blue trace overlaid upon JOER’s signal strength trace. JOER’s signal then recovered as the X-ray flux declined. (X-ray flux data were downloaded from https://lasp.colorado.edu/space-weather-portal/goes-x-ray-flux?duration=3&endDate=2025-11-10 )
So, we DXers apparently had observed a solar flare-induced “medium wave fadeout”, a special case of the more commonly observed shortwave fadeout. Such medium wave fadeouts are rarely observed, as they can only occur near sunset or sunrise at the receiver or transmitter sites, when skywave propagation should normally be possible through the daylit region near the terminator.
Conclusion
- Over less than one hour on 9 November 2025, DXers at Tanohata, Iwate, Japan, noticed a number of temporarily attenuated medium wave broadcast signals around local sunset
- Two unusual and unrelated events took place around that time: a nearby earthquake and a solar flare.
- The earthquake was obvious at the time, so the DXers looked more closely at the signal strength changes that had occurred to see if there could have been any relationship with the quake.
- The solar flare was discovered later, and it appears that the X-ray flux from the solar flare mapped more closely to the attenuations observed than did anything to do with the earthquake.
(The above was recently published in IRCA’s DX Monitor (ircaonline.org), is used by permission, and is based on presentations given at the seventh annual TDXC Convention 2026, held from January 11th to 12th in Chigasaki, Japan (https://www.tdxc.net/tdxc-convention/), and at the 9th annual HamSCI Workshop in Newington, CT on March 14-15, 2026 (https://hamsci.org/hamsci-2026-program) )
Appendix
Historical video by Satoshi MIYAUCHI
https://www.youtube.com/shorts/fneFARjIdBs
Reception videos of 2025 DXpedition
by Sakae OBARA
I love reports like this, really interesting to me! Great work!
My personal, unscientific and very general observation with solar flares and MW DX is that I did notice an attenuation of transoceanic (transatlantic in this case) signals in the aftermath of earthbound solar activity so regularly that I thought this is common knowledge? That I can receive only a very limited number of TA stations with regular equipment and at home may have helped making this observation, even small losses in signal have a significant effect on my ability to read the few stations that can even be demodulated; every time the spectrum looked unpromising enough to make me check this it coincided with high A- and K-indices. This is on NW paths along the pole and the “sample size” is low and only stored in meatware though, and I likely have my own unknown and unaccounted for variables..
Disturbances in the local geomagnetic field have been observed around earthquakes says Google but in my mind that should not have any effect on distant refraction points of skywave paths. If piezoelectric effects in the stressed soil could affect local ground conductivity (?) and therefore antenna pattern and/or gain that would be something to look at but I think my money would be on the flare as the main suspect too. Particularly the difference between single- vs. multi-hop distances seems to support this, more hops = more of the additional attenuation.
Next time when you guys order interesting phenomena off Yahoo.jp make sure you unticked the “combine orders to a single package to reduce packaging materials” checkbox. 🙂
Excellent research and sleuthing followed by methodical deduction. You didn’t stop at the “obvious” earthquake. Thank you for a marvellous read.
Noel
Congratulations Satoshi Miyauchi, JP1SCQ, with Nick Hall-Patch, VE7DXR on a superbly researched and documented and very clearly written article.
Your findings might prove to be a means to give advance notice of seismic events.
Thinking highly speculatively, I wonder if these observed changes in electromagnetic propagation relate to or correlate with the observed prescience by animals and sone sensitive humans of seismic events?
May I suggest that you send a copy of your article to:
1. Geological Survey of Japan
2. Japan Meteorological Service
3. The US Geological Service (USGS), both their head office and their Hawaii branch
4. The US National Oceanic and Atmospheric Administration (NOAA) at their head office and their Hawaii office
Thank you for sharing your research and findings!
73
Julian Stargardt