Radio Waves: Stories Making Waves in the World of Radio
Welcome to the SWLing Post’s Radio Waves, a collection of links to interesting stories making waves in the world of radio. Enjoy!
Holme Moss transmitter (BBC Archives)
A look at how the BBC’s third television transmitter in West Yorkshire was built.
These original masts broadcast to the surrounding population until 1985, when they were replaced by a new generation of transmitters.
Originally broadcast 12 October 1951
Click here to watch the video at the BBC Archives.
Sherwood Tools Available (K4FMH Blog)
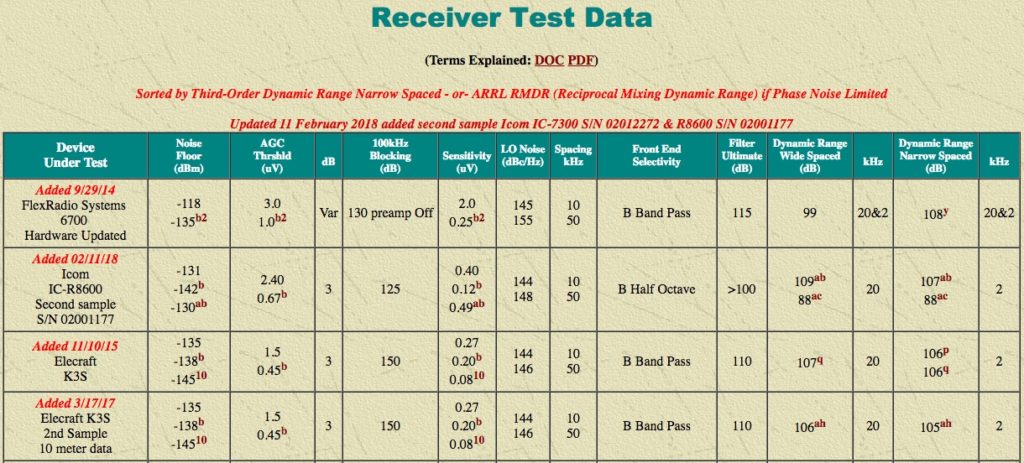
The work that Rob Sherwood NC0B has contributed to the public over the past decade is unique and an amazing service to hams worldwide. I’m talking about, of course, his summary Table of receive bench tests published at this Sherwood Engineering website. He is independent so no one can think that advertising dollars could skew his assessments or how he presents them. As a CW contest operator, he is very clear that he sorts his table on the basis of what his experience and training has shown him to be the single most important measurement in his table: the narrow dynamic range.
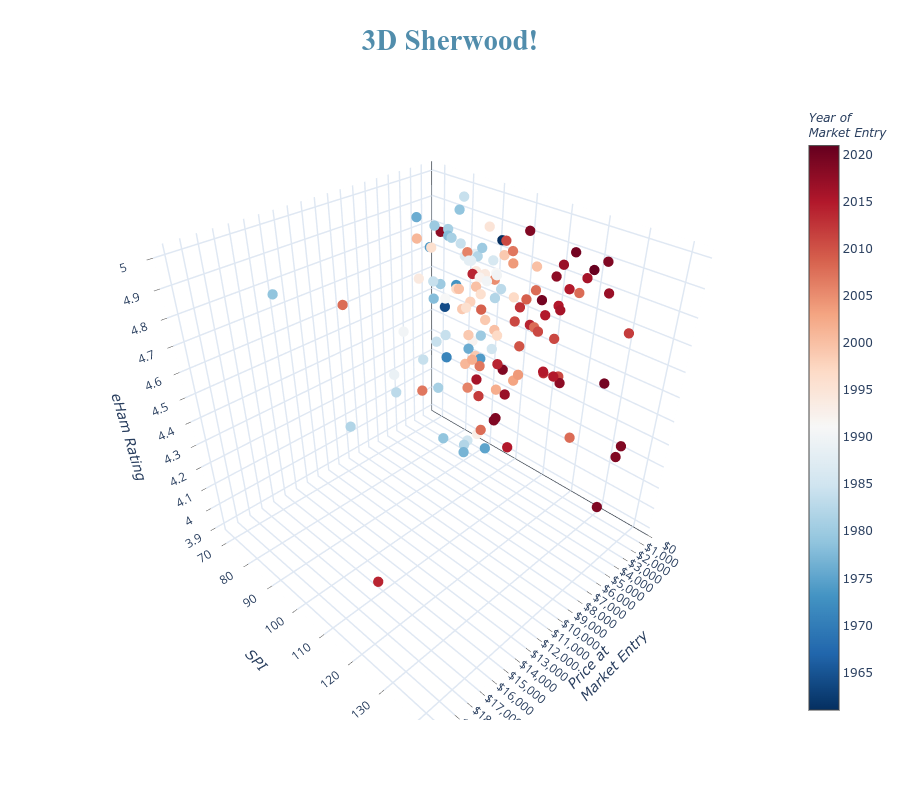
I am not a CW operator or accomplished contester (lol) but enjoy the latter with my small team of fellow hams. But I am a statistician who likes to focus on problems where analytic tools can help foster a wider understanding of the data surrounding the problem area. So, working with Rob NC0B, I’ve created a set of “Sherwood Tools” to visualize his data as well as link them to a couple of other critical aspects of a rig purchase: market-entry price, consumer satisfaction, and the year the radio entered the market. These four vectors of data drive all of these tools, now available over at foxmikehotel.com.
 The tools include a sortable Sherwood list where you can sort on any of the nine tests he publishes as well as the composite index of them that I created and included in my two-part NCJ articles in 2021. A set of 3D data visualizations are available to simultaneously view radios on four data elements (that does make it 4D, technically). Several graphs illustrate key aspects of the data, including how to not get tripped-up in the “ranking” of radios where the bench measurements are just not appreciably different. Seeing how the past 50 years of radios appearing in Rob’s Table have made a remarkable and clear progression toward the best receiver performance that modern test equipment can detect is in another tool. In addition, how the trend in getting a receive bang-for-the-buck has progressed over this 50 year period is there, too. Finally, I’ve used the industry-standard tool by Gartner, the Magic Quadrant, to help isolate radios in Rob’s Table that perform and are rated above average at various price points. I call these the Golden Quadrant Lists. Continue reading


