
![]() Many thanks to SWLing Post contributor, Bob Colegrove, who shares the following guest post:
Many thanks to SWLing Post contributor, Bob Colegrove, who shares the following guest post:
Calculate Station Distances Using Excel
By Bob Colegrove
Introduction
On occasion, I’ve wanted to know just how far away a station was from my home. I’ve never been much of a contester, but I know distance can play a part in the results. There are a number of Internet cites which let you enter latitude and longitude information and then calculate the distance across the surface of the earth. These are alright on an occasional basis, but I often wind up getting the data mixed for the two locations, and it is not handy when you want to make several measurements. Here’s a way to generate the distance from your home to thousands of stations with just a little effort.
Many years ago, armed with my faded knowledge of high school trigonometry, I used Excel to calculate the surface distance between any two points on earth. I managed to find the spreadsheet (file dated 1998) which has no fewer than 11 steps in the algorithm. Although it worked, when I came back to it a few months later to make a change, I couldn’t remember my thought process. There are Internet sites which develop earth surface calculations in highly esoteric terms and heavy-duty math. But life is short, and I wanted to cut to the chase. There are, in fact, several formula variations which have somehow managed to distill all this down to a neat single-cell calculation, and they seem to work very well.
Construction
The spreadsheet figure below is the simplest form used when you have decimal latitude and longitude data as input. The convention is to use negative numbers for the Western and Southern Hemispheres. Home is your reception location and all other locations are compared with that to determine the distances. If you’re curious, the home location (yellow cells) used in these examples is the monument marking the geographic center of all 50 US states in Belle Fourche, South Dakota. Google Maps is one easy source to determine the exact latitude and longitude of any point on earth.
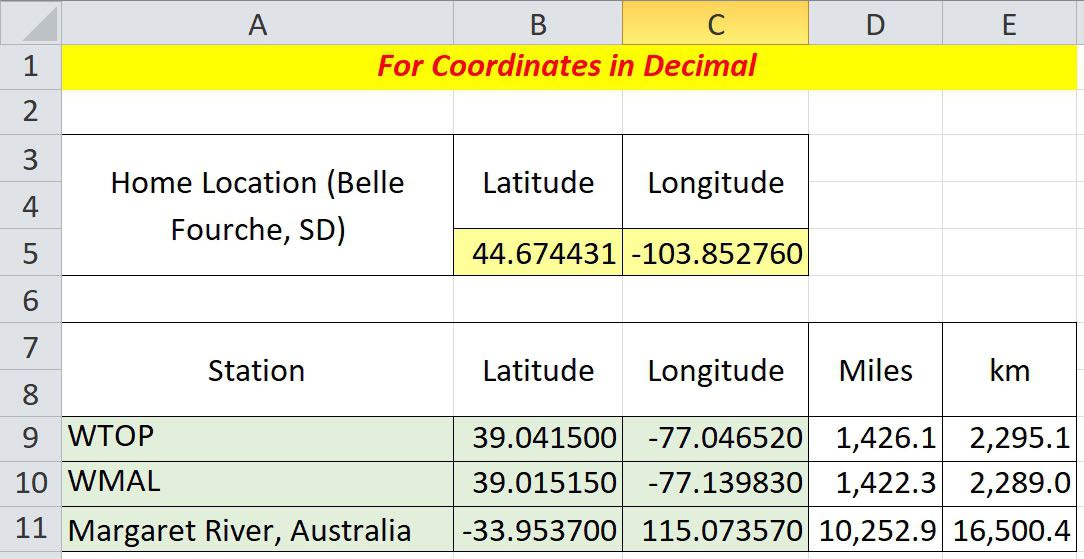
To calculate the distance between any two points on earth, copy the formula below directly into a cell, then change the reference cell names as appropriate, and you’re ready to go.
=ACOS(COS(RADIANS(90-$B$5)) * COS(RADIANS(90-B9)) + SIN(RADIANS(90-$B$5)) * SIN(RADIANS(90-B9)) * COS(RADIANS($C$5-C9))) * 3959
$B$5 and $C$5 are the cell references for your home address (yellow in the figure above). Of course, the dollar signs indicate these data remain fixed in each calculation. B9 and C9 are corresponding latitude and longitude for the example radio station, WTOP (green). Change these four cell locations as necessary. The constant, 3959, at the end of the formula is the average radius of the earth in miles. Use 6371 if you want kilometers. The data cells in Columns D and E are populated with the formula and produce the result. These values are dynamic and can be replicated down the columns for the rest of your station location data.
Degrees, Minutes, and Seconds Format
The US FCC on-line database contains latitude and longitude tower locations for medium wave stations in Region 2, North, South, and Central America. However, coordinates are in degrees, minutes, and seconds format and must be converted to digital format for calculation of distances. The conversion process can also be done in Excel.
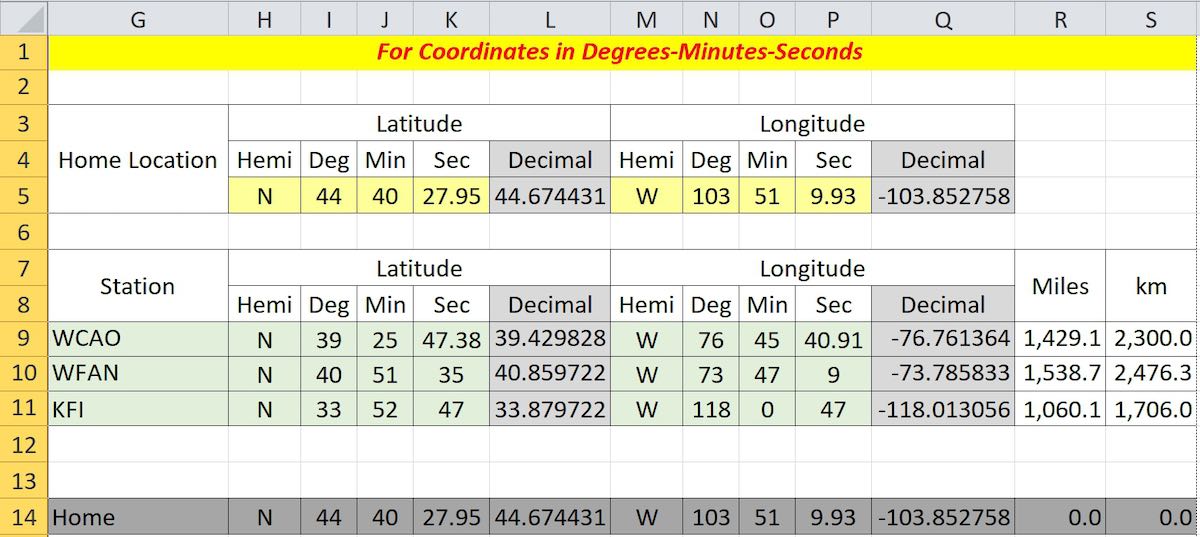
In this case, the inclusion of the coordinate hemispheres, N or S, and E or W is important. Whereas, the hemispheres in the decimal example were signed + or -, the inclusion of the appropriate letters here is necessary. Cell L5 reads
=IF(H5=”S”,-I5-(J5/60)-(K5/3600),I5+(J5/60)+(K5/3600))
and cell Q5 is similar for longitude, except “W” is substituted for “S.” These formulas are then replicated in columns L and Q for each data item. Columns R and S contain the distance calculation formulas as described above. Line 14 is not necessary, but can be used to see if your formulas are correct; that is, the distance from home to home should be zero.
Let Excel Get the Information for You
What follows is for anyone tired of copying cumbersome latitude and longitude data. Unfortunately, it only works on the current version of Microsoft 365 Excel, and apparently goes off into the big cloud in the sky to instantly download the information.
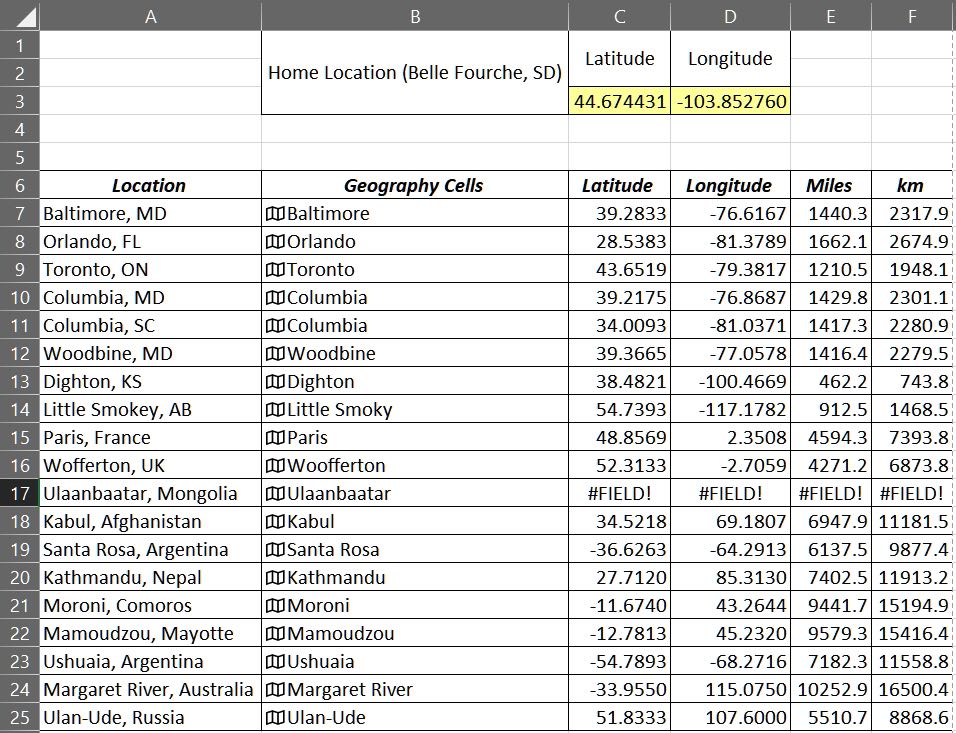
- Enter the town followed by either the US state, Canadian province, or other country name (Column A).
- Copy these locations to the next column (Column B). The cells in Column B will become temporary geography cells. Note: As shown above, the data have already been converted to geography format (Step 4).
- Make sure you have all the geography cell locations selected (Column B).
- On the Data ribbon select Geography. A map icon will appear at the left of each cell, and the state, province and country will be truncated.
- For the first latitude (Cell C7), enter =B7.Latitude; likewise, =B7.Longitude in Cell D7.
- The formulas in C7 and D7 can be replicated down your list.
- Columns for miles and kilometers (E and F) can be added using the distance formula as described above.
The geography data (Column B) cannot be replicated. If you want to add data later, you will have to reapply the geography format for the new data. Or, latitude and longitude can still be inserted manually for any additional entries. The geography data (Column B) are not needed beyond this point and can be deleted or hidden.
Note: I logged on to my first mainframe computer in September 1976 and have never ceased to be amazed at what these confounded things can be made to do. I tried as best I could to trip the system with small, obscure towns in faraway places, as well as duplicate names. I finally succeeded with a relatively large city, Ulaanbaatar, Mongolia. To be fair, I tried to get it to accept alternate spellings. So, if you need that one, you’ll have to enter it manually.
Medium Wave Example
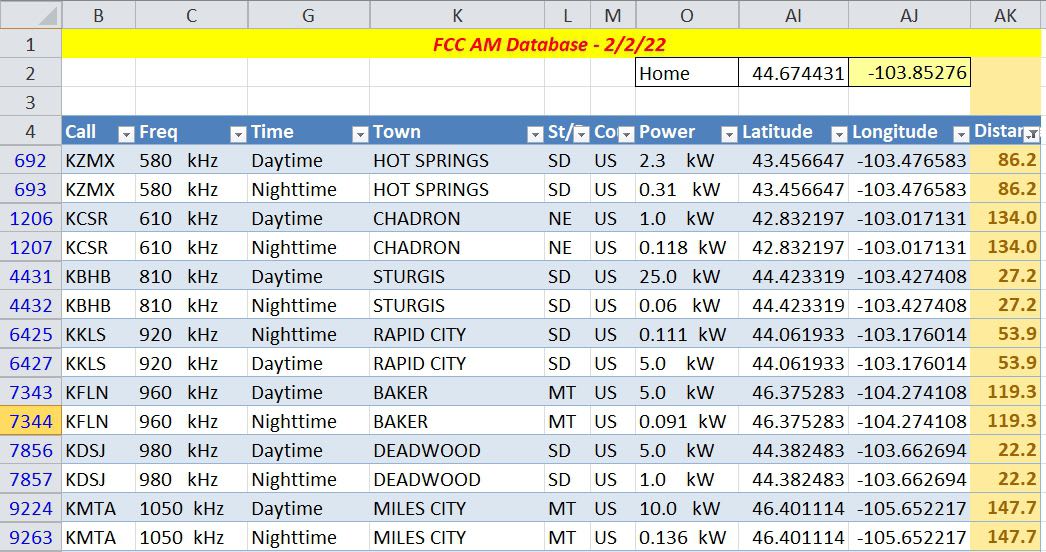
This example is for medium wave DXers in Region 2, the Americas. It makes use of the FCC AM database at https://www.fcc.gov/media/radio/am-query. The database currently contains more than 24,500 entries, many of these are duplicate entries for stations using different daytime and nighttime powers.
- Download the database as a pipe-delimited text file.
- Import the file into Excel.
- Create additional columns to convert the latitude and longitude data from degree-minute-second format to decimal as described above.
- Add some rows above and enter your home coordinates in decimal.
- Create another column to calculate the distance from home to all the stations, again using the base formula above.
- Hide any columns in the FCC database that you don’t need.
- Finally, by creating an Excel table from all of the data, except your home location, you can do some on-the-fly filtering.
The example below shows some of the stations near our example home in Belle Fourche, South Dakota. The Distance column on the right has a filter applied to limit the listing in the table to stations within a 150 mile radius, that is, it only lists potential daytime stations. You could also use the conditional formatting feature of Excel to highlight the same information in the unfiltered data.
Shortwave Example
The AOKI log, http://www1.s2.starcat.ne.jp/ndxc/, has listings for all of the recent broadcasting cycles, B21, A21, etc. The Excel format files are zipped for download, and include the latitude and longitude of each station. Unfortunately the coordinates are not only in degrees, minutes and seconds, but they are all mashed together in one cell for each listing. Excel to the rescue again. Select Text to Columns in the Data Tools portion of the Data ribbon. This feature will allow you to divide the single column into four columns each for latitude and longitude, that is, degrees, minutes, seconds and hemisphere. Then you can use the conversion formula to change degrees-minutes-seconds to decimal. Note that the first three digits used for longitude are minutes (they go up to 180); the remaining numerical columns have two digits each (up to 60 or 90), and the hemisphere columns (alpha) one character each.
Accuracy
Here are a few things affecting accuracy:
- The constants 3959 or 6371 used in the formula for miles and kilometers are generally accepted averages for the earth’s radius. The difference between the equatorial (longer) and polar (shorter) radii is about 13 miles.
- If you are using town locations in your data, remember that the actual distance to the tower in that town is likely to be different. The FCC and AOKI data are assumed to be station tower locations.
- Some decimal sources of latitude and longitude data have less resolution, which could lead to a slight error.
You’re on Your Own
You may have noticed the examples shown in the figures all have multiple station locations. My thought in doing this was provide some test for accuracy and secondly to provide a seed for developing the spreadsheet into a more inclusive log of stations. There is likely enough basic Excel knowledge among the folks gathered here, and each person will likely have an individual preference in designing a spreadsheet. Nevertheless, the spreadsheet shown in the figures can be downloaded by clicking this link.
The first sheet shows Figures 1 and 2 from this article; and the second sheet, Figure 3. The link in Cell I2 of the second sheet describes how to use the geography feature of Microsoft 365 Excel. The third sheet is a recent copy of the FCC AM database (Figure 4). To facilitate storage and downloading, only stations from 530 kHz to 600 kHz are included. Numerous unused columns from the FCC AM database have been hidden; so you can still copy the full, pipe-delimited FCC database into Columns A through AH. The FCC database has been converted to an Excel table; the Home location is not part of the table. Try substituting your own location for Home (Cells AI2, latitude and AJ2, longitude) and setting a distance filter from your home in Cell AK4. In the example, the distance filter has been set limiting the list of stations to less than 600 miles from our example in South Dakota. Note also that the Conditional Formatting feature on the Home ribbon has been used to highlight stations less than 100 miles from home.
If you have any interest in developing your own spreadsheet, perhaps you can comment on what you have done, or provide the rest of us with something I have missed. Hopefully, I have provided enough information to get you started.