Many thanks to SWLing Post contributor, Loyd Van Horn, who shares the following announcement:
FOR IMMEDIATE RELEASE
DX Central Unveils SEDAP: The World’s Most Advanced Sporadic Es Data Analysis Dashboard for the FM DX Community
MANDEVILLE, La. — April 29, 2026 — DX Central is proud to announce the official launch of version 2.0 of our popular Sporadic Es Data Analysis Project (SEDAP), a revolutionary, interactive intelligence dashboard designed to decode the mysteries of VHF propagation. Officially unlocking on Friday, May 1, 2026, at 7:45 PM CDT (0045 UTC May 2) at fmdxdata.com, SEDAP transforms nearly a decade of siloed radio loggings into a massive, cinematic data science suite, completely free of charge for the hobbyist and academic community.
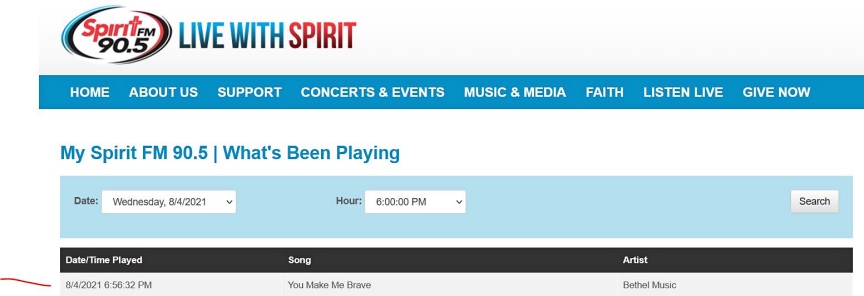
Historically, analyzing Sporadic E (Es) propagation on the FM band has been an isolated effort, with individual DXers tracking their own localized season-over-season metrics and comparing notes with other DXers. SEDAP shatters that limitation by aggregating more than 95,000 North American FM broadcast logs and presenting them with brand new interactive visualizations to give DXers a whole new understanding of this elusive and magical propagation method.
“For years, our understanding of Sporadic E has been largely limited to individual observations,” said Loyd Van Horn, founder of DX Central and creator of SEDAP. “By bringing all of this data together, we aren’t just looking at spreadsheets anymore. SEDAP allows us to physically watch ionospheric clouds spawn, compress, and track across the continent in real-time. We can finally see what a typical season looks like on a macroscopic level.”
Built on a Google Cloud BigQuery architecture, SEDAP boasts a sleek user interface featuring dynamic visualizations, including:
- The Es-Cloud Tracker: The newest and perhaps most exciting addition to the SEDAP dashboard. The Es-Cloud Tracker is a cinematic, multi-day playback engine that maps the approximate geographic formation location of FM DX Sporadic Es ionization clouds over North America. Openings can be “played” on a timelapse, allowing DXers to watch a simulation of the Es clouds as they develop, morph and transit throughout the day or a range of days.
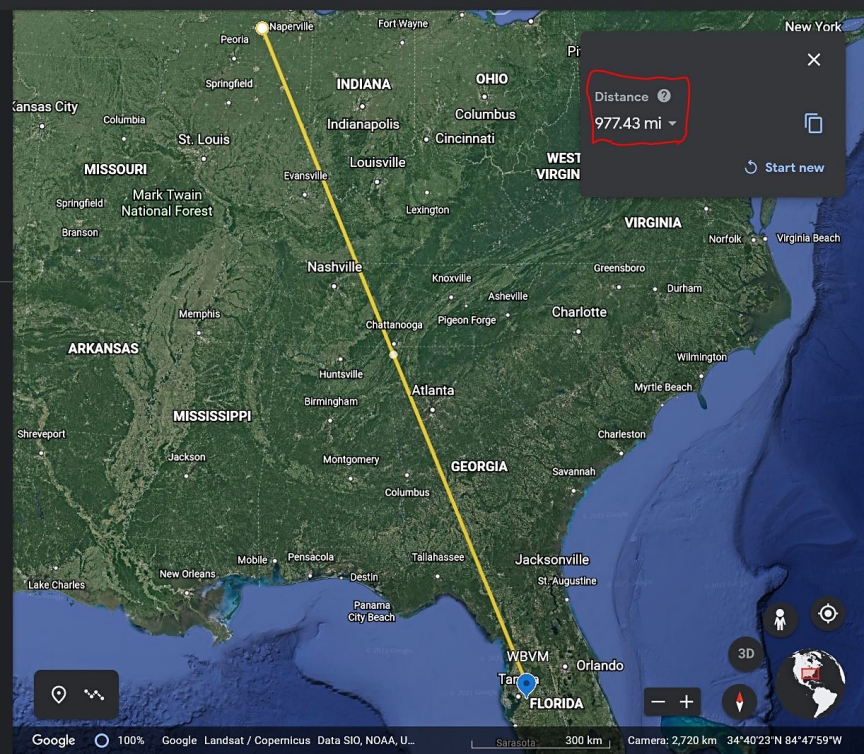
- Path Line Analysis: In-depth analysis on the most common and productive paths to and from a DXer or station location. Visually “see” the paths that evolved over the span of a day or date range.
- Frequency & MUF Forensics: An interactive “SDR Tuner” interface to interrogate large scale band yields, signal paths, and daily Maximum Usable Frequency (MUF) ceilings.
- Station & RDS Intelligence: Deep-dive forensics into the WTFDA station database, featuring PI-Code adoption maps, format/slogan correlation matrices, and gamified “Unheard Target” lists for US States and Counties.
- DXer Network Intelligence: Long-term seasonal performance audits and multiple normalized metrics to filter out observer bias as much as possible
- “We have certainly seen a huge growth in the number of DXers both reporting receptions and the amount of receptions they are reporting thanks to improved technology and resources from SDRs to propagation monitoring through Rabbitears and the FM DX Webservers,” says Van Horn. “So while we are not here to say one season was better than another, we can give DXers insights into Sporadic Es season that can help them strategize antenna placement and bearing, timing of monitoring, potential paths based on different periods within the season and a whole lot more. This is about improving our understanding of what happens when the ionosphere sends those FM signals back down to Earth.”
SEDAP makes no claim of ownership over the raw data presented, acting strictly as an analytical engine. The platform owes its immense capabilities to the unprecedented collaboration and public data provided by FMList.org, and the Worldwide TV-FM DX Association (WTFDA).
To protect the integrity of the database and respect the bandwidth of its data partners, SEDAP is strictly governed by a non-commercial usage policy. Automated scraping and commercial monetization are prohibited, but users are highly encouraged to explore, share, and cite the dashboard’s findings.
The Sporadic Es Data Analysis Project will be accessible to the public beginning May 1, 2026. To access the dashboard, view the real-time launch countdown, or read the full data usage policy, visit fmdxdata.com.
About DX Central: Based in Mandeville, Louisiana, DX Central is a premier hub for the radio monitoring community, dedicated to advancing the hobby of DXing through live streams, online receivers, regular DX challenges and contests, educational content, and data-driven propagation analysis.
Media Contact:
Loyd Van Horn | Founder, DX Central
Email: [email protected]
Web: dxcentralonline.com
Youtube: youtube.com/@DXCentral
Twitter/X: twitter.com/DXCentral
Loyd Van Horn
W4LVH – Mandeville, LA
Member: IRCA/NRC Courtesy Program Committee (CPC)
Founder: DX Central – Because we’re all about radio
Web: dxcentralonline.com
Twitter: @DXCentral
YouTube: youtube.com/c/DXCentral