
Many thanks to SWLing Post contributor, 13dka, who shares the following guest post:
In search of benchmark signals: The International Beacon Project
by 13dka
If you – like yours truly – like to tinker with antennas and radios to get the most out of them, you likely have your own set of reference stations. If this is a new concept for you – reference stations are whatever stations you deem apt to check propagation, the general function of your radio, when trying to improve reception or comparing radios… They are ideally always on when you need them and come in various strengths and distances on several bands from all over the world. Traditional sources for that are of course time signals and VOLMET stations on HF, even though the latter are giving you only two 5-minute slots per hour for testing reception from a specific region and the former have their own specialities here in Europe:
A typical scene on 10 MHz, captured at home 30 minutes after the full hour: BPM voice ID from China mixed with something else, then Italcable Italy kicks in on top of some faint murmur possibly from Ft. Collins, in winter some South American time stations may stack up on that together with splatter from RWM 4 kHz lower…
A reliable source of grassroots weak signals is particularly desirable for me because I enjoy proving and comparing the practical performance of radios at “the dike”, a QRM-free place on the German North Sea coast. In the absence of manmade noise and the presence of an ocean adding 10dB of antenna gain, finding benchmark stations with “grassroots” signal levels turned out to be a different challenge than it used to be: With somewhat sizeable antennas the stations tend to be (too) loud there, even with the baseline ionospheric conditions under a spotless sun in its activity minimum. In short, my old benchmark stations didn’t work so well anymore and I had to find something new.
The International Beacon Project (IBP)
You may have heard of the International Beacon Project before and maybe you have also seen it on a KiwiSDR (they have presets for the IBP frequencies in the bands pulldown list), and how the OpenWebRX client shows you what beacon is on right now. I have to admit that I was completely ignoring the existence of the IBP until recently, maybe because I rarely heard any of them when I tried on the Kiwis. Then I stored the 5 frequencies in my little Icom to check how I would hear them at the dike and only there I fully realized that they’re exactly what I was looking for. When I started to process recordings of the stations back home I started to understand how surprisingly useful they might be!
How it works
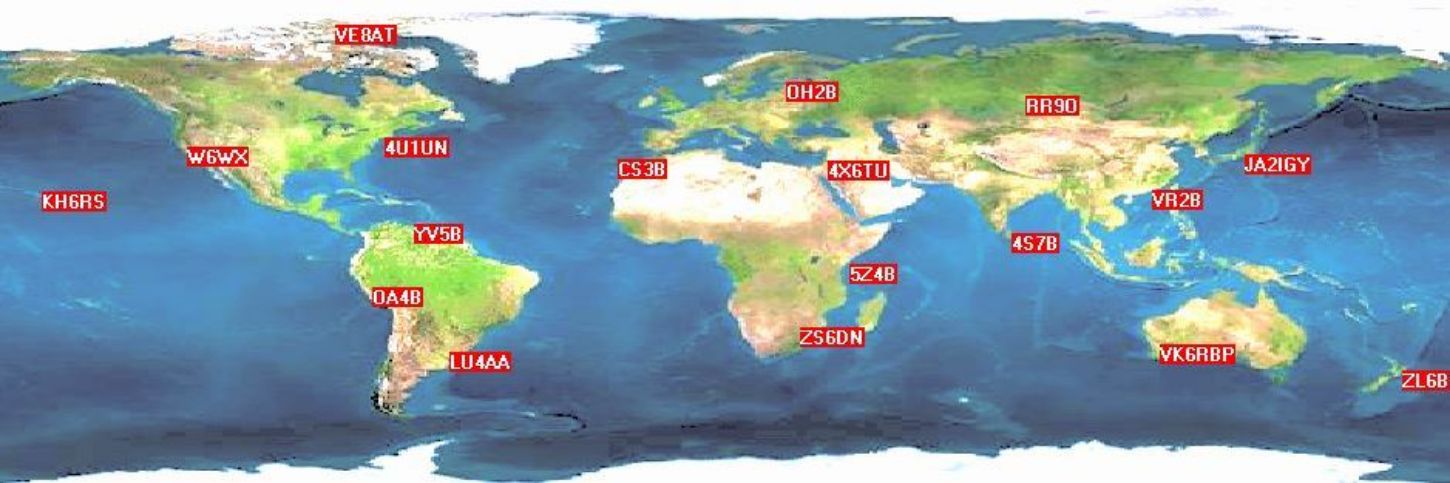
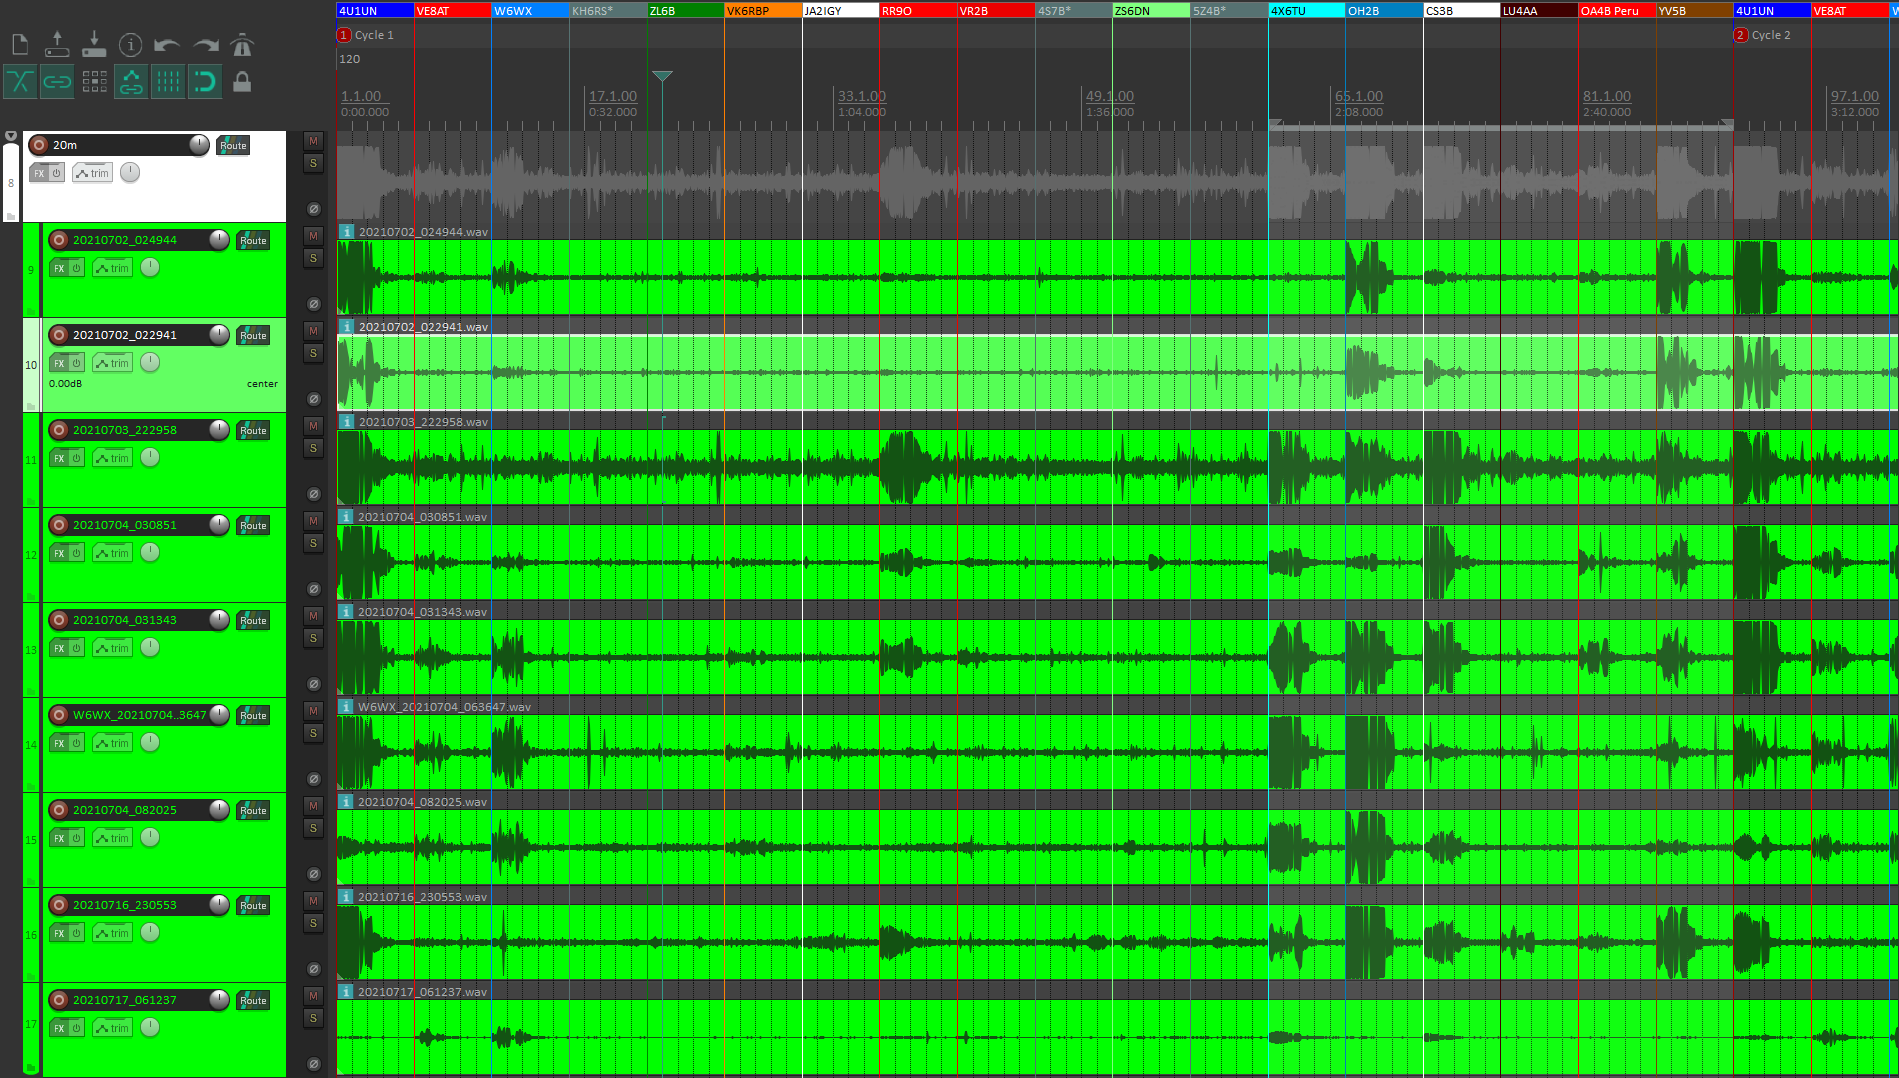
Unlike the classic low-power propagation beacons scattered over individual frequencies, the IBP consists of 18 beacons with common properties and a common transmit format, spread over (almost) all continents to populate only one frequency per band in a precise, synchronized 3-minute schedule. Here’s the station list with a transmit schedule for 20m/14,100 kHz:
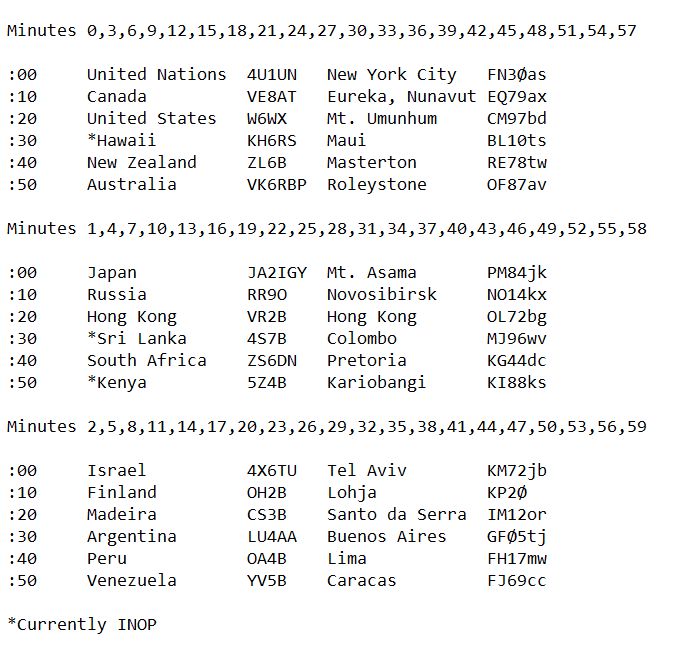
Each beacon has a 10s-slot within the 3-minute cycle, after completing a transmission on a band it will hop to the next band until the 10m-band was reached. That means each station will start on 20m (14,100 kHz), 10s later it will be on 17m (18,110 kHz), 20s later on 15m (21,150 kHz), 30s later on 12m (24,930 kHz) and 40s later on 10m (28,200 kHz). Then it will wait its turn in the 3-minute cycle on 20m again.
That also means that you don’t need to learn code to identify the beacons: All you need is a freshly synchronized clock on your wrist, computer or smartphone, this website has a live-updating schedule for you and a list of applications for all platforms and devices.
Fun with beeps and boops
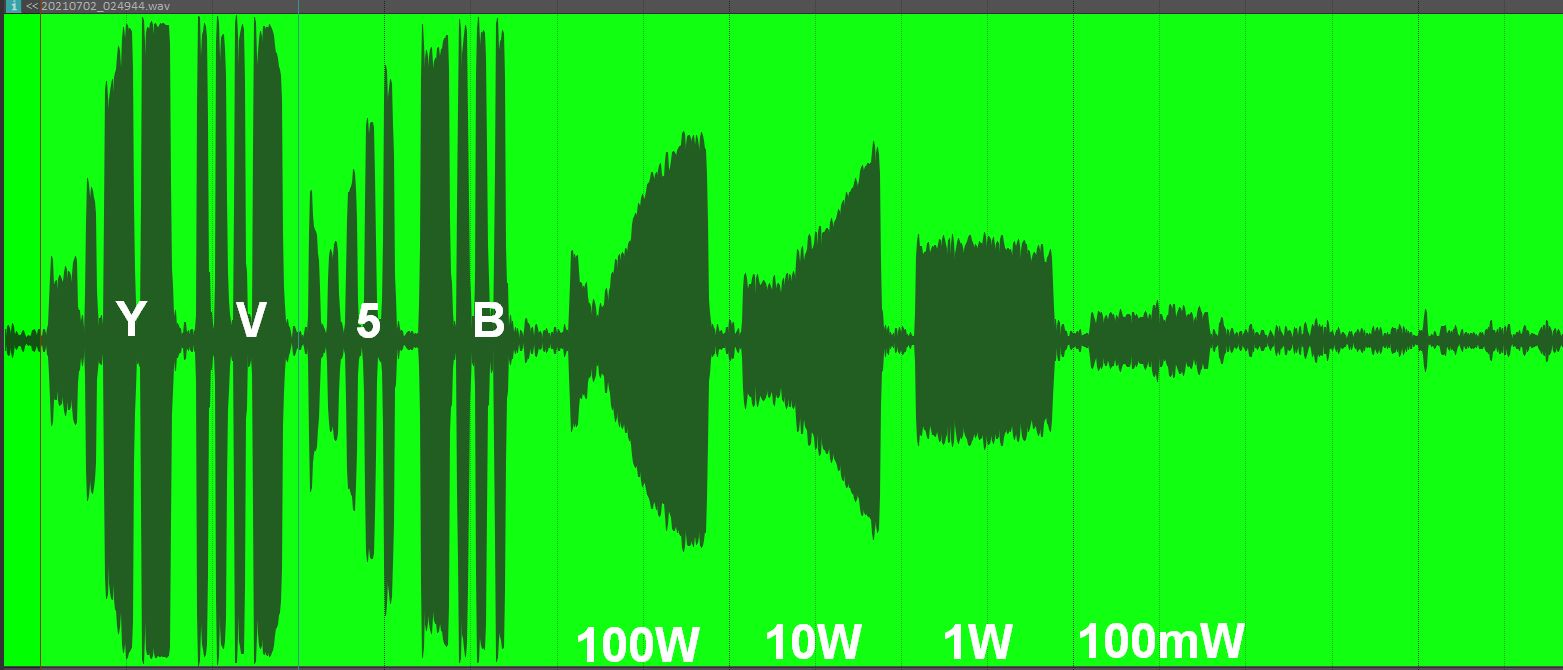
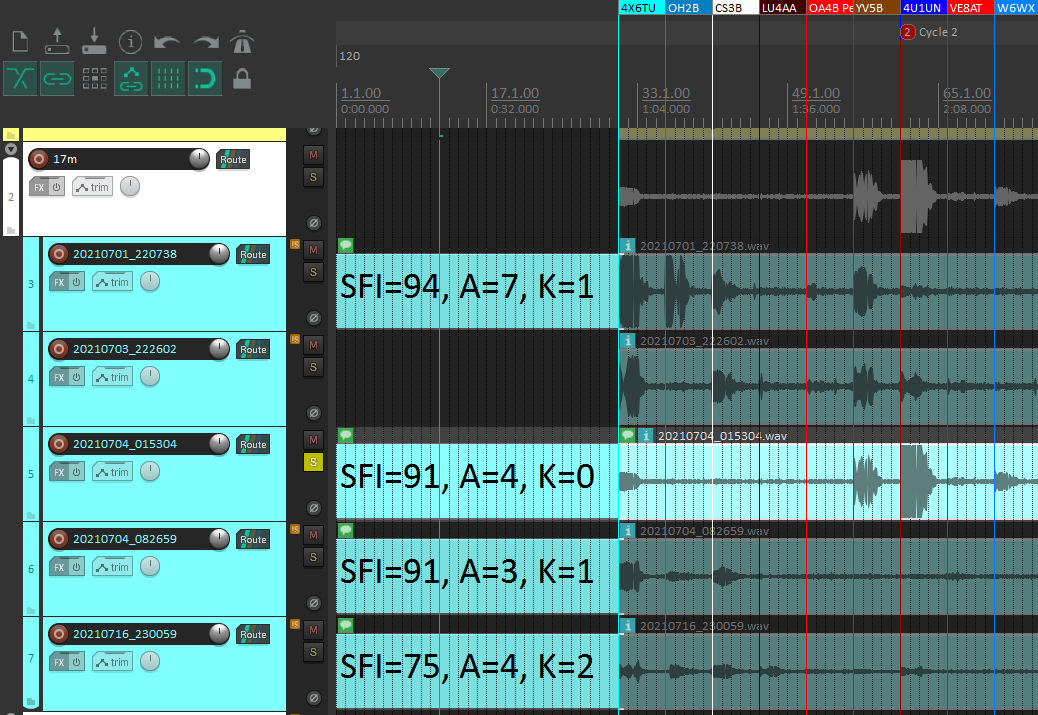
Every beacon is a very challenging DX target in itself, and the IBP beacons come with a built-in scoring system! Each beacon transmits its callsign and a 1-second dash with 100 watts (which is a lot for a beacon) plus 3 consecutive dashes with 10W, 1W and 0.1W:
If you can hear the callsign and/or the first dash you know there’s a path open into that continent, the 2nd through 4th dashes are telling you how good that path is currently – a great tool to assess actual, practical, worldwide propagation conditions within 3 minutes per band. That sure beats staring at abstract ionosphere index numbers if you want to know what the bands (at least the upper bands that is) are like right now on your own radio.
More to the point, the 4 dashes immediately challenged me to work on making as many of them audible as possible! 🙂 Sorry for the following show-off but I found myself inappropriately fascinated by the 1W and 100mW signals: It’s not that this could be really compared, but imagine how much light a 1W lightbulb would emit (that’s half of a classic bicycle bulb) and how far that light could travel, let alone how far 100 milliwatts (1/7th of an oldschool radio dial bulb) would shine, but in form of HF that power can have a stunning reach:
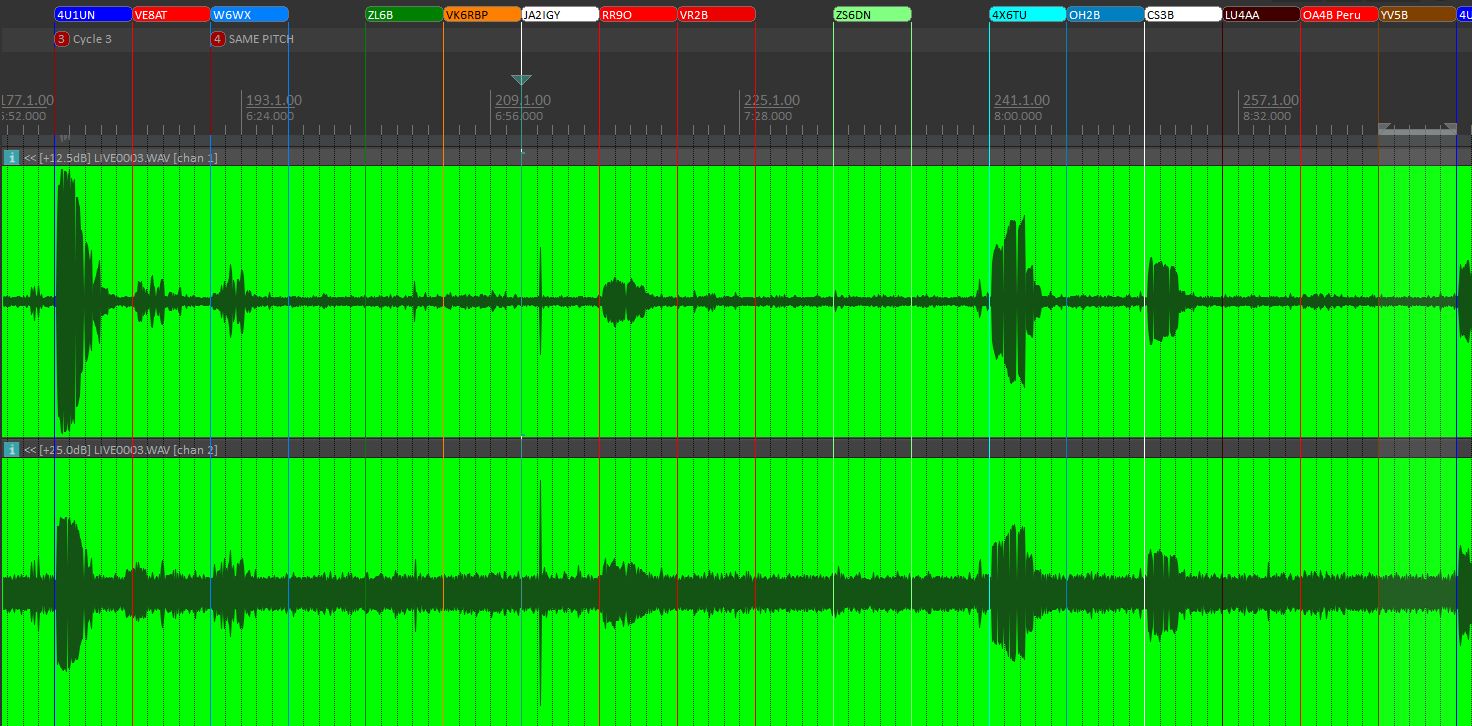
This is the 4U1UN beacon on top of the UN headquarters building in NYC, nearly 6,000 km or 3,730 miles across the Atlantic ocean from here, 3 times in a row, the first two clips were recorded July 2nd and July 4th on 20m, the third one (0:18s) is the 17m-band, also on July 4th:
YV5B in Caracas, Venezuela (8,135 km / 5,055 miles), first on 14,100 kHz (July 2nd, 0:29am UTC) then on 21,150 kHz (July 3rd, 20:38 UTC):
Here’s W6WX in California (8,816km / 5,478 miles) on 14 MHz, recorded before sunrise (2:57am UTC), timestamp 0:09 after sunrise (4:36am UTC), and quite unexpectedly on 18 MHz at midnight UTC (timestamp 0:19s, only 3 dashes):
Bragging aside, once my excitement wore off a little I realized how useful this could be:
The world signal generator
IBP beacons are always there of course, unless they’re having some kind of problem (currently Hawaii, Sri Lanka and Kenya are offline), so there should be at least one to pick up every 3 minutes, at any time of the day. Besides indicating propagation, they provide weak signals from all important compass bearings over the course of a day and even if some of them come in pretty strong there are still the 3 weaker dashes to work with. The useful 10dB power-stepping of these dashes makes the IBP a uniquely meaningful signal source to assess and compare receiver sensitivity, or more generally the whole receiving system performance, and for optimizing antennas for specific target areas etc. – you also get signals from countries that currently have no other or no reliable indicator stations.
Even more, since they are CW signals, recorded audio signals and their waveform plots directly reflect SNR (at least when they’re weak so the AGC doesn’t play a role), so if the recording gain level is always the same (like it is in the IC-705’s audio recorder), recordings made at different times can be compared and put into relation to each other – even visually:
A practical example would be recording a few 3-minute cycles before e.g. connecting a radial or lifting a wire support, then recording another few cycles after the change. If the difference is less than dramatic, the more subtle differences can be analyzed and verified using the recordings, maybe later in the quiet of your home shack if you make experiments in the field without bringing a computer. Beats listening to a station, dashing outside and making a change, then listening to the station again minutes later when you forgot what it sounded like before.
By importing all recordings into the same project into a multitrack editor like in the image above, I can keep a whole history of recordings and compare new recordings with it, for example to verify vague sensations (“I feel that radial helped a little with stations from Japan“), to prove that a perceived improvement wasn’t just a fluke by making enough recordings so I can average out day-to-day or hourly variations. Of course it would be good to keep track of the conditions at the time of the recording to include them in any considerations:
Proof of concept: David’s little brother vs. Goliath’s little brother
Maybe you can understand that I was keen on trying this on some practical receiver test. I also took the opportunity to try my now slightly improved setup for receiver comparisons (imaged below): The signal from a common antenna (a simple vertical wire on a 33ft/10m fiberglass pole, pictured on top of the article) goes into a Diamond SS-500 splitter box (not visible), from there to the two receivers to be compared, recording their audio signals is done via line-out into a little digital field recorder.

Because it’s the only other radio with a proper CW filter I own, and also my only other radio capable of taking all the voltage my favorite dikeside antennas can deliver, I had to run my little Belka DSP against the 10dB more expensive IC-705. This is not exactly an apples-to-apples comparison: The Belka’s antenna input is designed for a good match to its short whip, so what makes this radio so brilliant in that role can mean a less than ideal or at least a different match to (passive!) external antennas, depending on the frequency. That’s why I’m not entirely sure how much of the difference is owed to impedance issues. I should also say that I couldn’t reverse that test and let the Icom run against the Belka on the Belka’s turf: On a 26″ short whip, the Belka would wipe the floor with the Icom.
The band conditions were slightly disturbed and below baseline when I went to the dike before sunrise on July 17th, and unfortunately thunderstorms rendered even the 20m-band pretty noisy. I started the experiment with some old standard frequencies and tuning in VKA-931 (aka “Australian VOLMET”) on 11,379 kHz the Belka did an impressive job in SSB there, not only if you consider that the little Belka costs 1/10th of an IC-705:
Short repetitions of the same transmission, first from the Belka (indicated by a series of low tones), then the Icom (marked with a short high double “dit”.).
For reference, here’s the same station (on the 705) when the conditions are not “slightly disturbed”:
Then I tuned the radios to 10 MHz and had them listening deep into the time signal murmur on that frequency. That’s also a good example why weak AM or SSB stations can be difficult to compare: I had to listen to this 20 times in a row with headphones on to make up my mind about the difference.:
The Icom hears a very faint WWVH time announcement, the Belka (0:06s) has obviously more noise but still hears that faint female voice.
Back to the IBP beacons: To level the field, I had to adopt the 300 Hz CW-bandwidth of the Belka on the Icom, which would otherwise be set to 100 Hz for an even better SNR on these beacons (you heard that on the examples in the bragging section above). After loading the recorded files into my DAW back home, the difference in SNR between the radios looked pretty dramatic:
The Icom on top, the second waveform below is the Belka DSP.
In practice, it’s not half as bad as the magnified waveforms on the picture seem to indicate – only when the signals were very borderline even on the Icom, the difference becomes obvious (all clips: 0:00s is the Belka, 0:09s is the Icom):
The VK6RBP beacon near Perth…
…and OA4B in Peru:
These signals are so weak that I need headphones to hear them properly even from the Icom and it shows that the overall advantage of the IC-705 over the Belka is only a few dB. Remember, making minuscule differences obvious is the whole point of this setup and this is all happening far down in a level range where S-meters can’t even indicate a signal yet.
When the signals have a little more “meat”, the dashes should show the difference. Here’s 4U1UN again:
Well, that didn’t really work, right? Shows once again how incredibly close the Belka is to the Icom. Let’s try W6WX on Mount Umunhum nr. San Jose, CA:
RR9O in Siberia, nice example without the fluttery fading and lightning crashes – that’s “almost 3 dashes” for the Belka and “almost 4 dashes” for the Icom:
Again, this was just a “proof of concept” and not meant to be a receiver review. But if we pretend it was, I could write something like “…while the reference receiver made the 100mW-dash faintly but clearly audible, receiver X picked up the RR9O signal down to a solid 1W-dash and a ghost of the 4th dash, the other beacons were even a little more ambiguous – an excellent result!”. In other words, the IBP beacons can make pretty small differences coarsely quantifiable…by ear.
The method has a few limitations of course: To begin with, receiving these very weak signals is really a challenge and for example, in the noise of my home I can barely receive one of them. If a radio doesn’t have CW, the SSB filter has to be used and then the frequency neighborhood could become a problem and it may not work well on contest weekends, at least not on 20m. It also doesn’t tell much about filter shapes or sound quality, SSB intelligibility or AM performance, but that’s where the other reference stations (as shown above) complete the “world signal toolbox”.
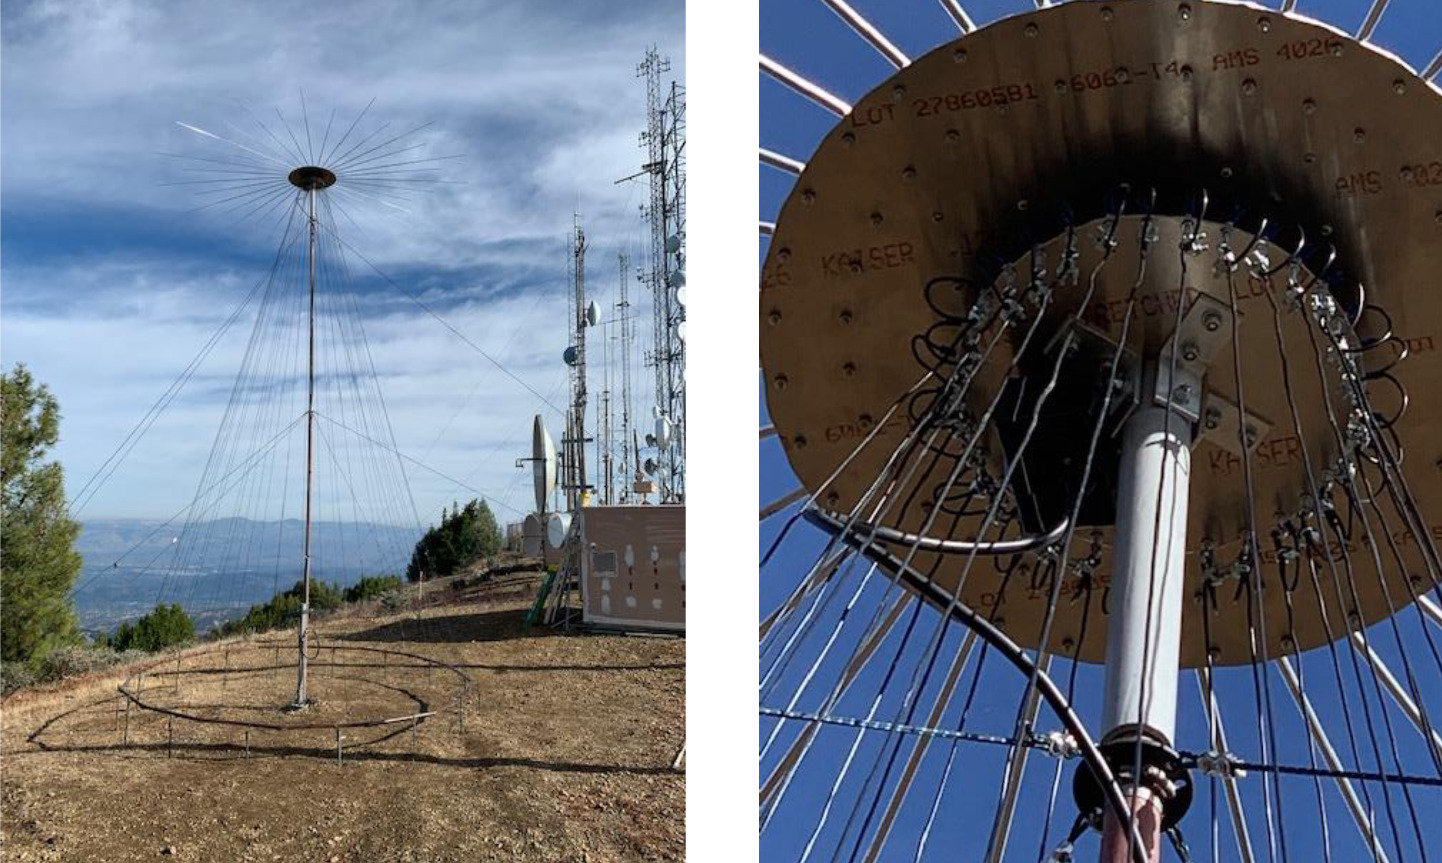
W6WX beacon discone antenna on Mt. Umunhum
Conclusion:
This “IBP”-method seems to be a pretty meaningful way to assess or compare practical sensitivity and noise. Yet again it underlines the importance of a QRM-free environment: Due to the 10dB power stepping of the dashes I can say with some certainty that only 10dB (likely even less) of manmade noise on top would have made the sensitivity of both receivers look identical. Instead, it allowed me to demonstrate roughly how much difference there is between two receivers.
That the CW nature of the reference signals can make audio recordings of them a helpful, even visual tool for short-term and long-term comparisons and experiments with my toys was a surprising find for me. I have yet to prove its practical usefulness but I’m pretty sure it will be helpful for e.g. a practical evaluation of antenna concepts and maybe things I haven’t thought of yet.
So what are your “benchmark” and “reference” stations? Please comment!
– Ollie (13dka)
I listen a lot to the IBP, gives me an idea what the higher band(s) are like and where the prop is running currently, very useful.
Great post btw!
Simply Perfect…
Thanks.
Giuseppe Morlè iz0gzw.
Thank you, Giuseppe!
I just love this kind of articles! Thank you very much.
Here I Use my ELAD FDM-S2 and some useful pieces of software to monitor and decode four HFDL channels. After ten minutes the positions of approximately a houndre planes are collected, and just a short glance at the PlanePlotter map show me where the planes I have decoded are located. This is an indication of the present propagation.
My SWL friends call it the “Lazy Method”…
73
Egil – LA2PJ
+1 on that, great article indeed, thank you.
Dave.
Thank you too, David!
Hi Egil, thank you for commenting and yes, digital stations in general offer a lot of great opportunities for that! I didn’t think of HFDL stations yet, thank you! The NAVTEX frequencies offer a similar permanent “service” (albeit slower) and I know that many people just run WSJT for a short while to get a list of what’s on, complete with signal reports from the software and due to the nature of FT8/JT-nn this even works pretty well in the QRM of my home.
I’m occasionally checking the market for an ultraportable laptop that I like and that runs my favorite Windows ham radio software at the dike, but I would use that more for the DXing aspect – I would love to receive some weather map plots from really remote WEFAX stations or log some very distant NAVTEX stations etc.
Recently, I was using the time stations 5, 10, 15, and (even) 20 MHz. To do some antenna comparisons on my Satellit 800. The Satellit 800 has three different antenna inputs for hf: 500 ohn (wire clips), 50 ohm (coax), and the on-board whip antenna.
Keeping a close eye on the signal strength meter, I could see which antenna performed better. I found that my horizontal room loop — a 50 foot wire around the ceiling of my radio room — performed the best, and, curiously, even though when the wire was hooked up as a loop, the signal through my headphones was quieter, when the antenna was connected as a simple longwire, the signal-to-noise ratio was better and the signal was easier to copy.
Of course, I also use the time stations as a rough indicator of which signal bands are “heating up.”
Your piece on the international beacons is excellent. Well done!
Thank you for the comment, Jock! Yes, the ear on the SNR is even more important than the eye on the signal meter, and sometimes it turns out a wire can be better than a loop even in local QRM.
Really interesting article and testing method! Very useful! Cheers!
Thank you, Robert!
Another masterpiece, 13dka! I love how you explore a topic like this, take us a little deeper, than take us WAY deeper! It’s just brilliant. I’ve never taken full advantage of the IBP. In a way, it’s a nearly ideal platform to use for receiver sensitivity testing: a consistent, predictable signal source with a known geographic location and power output scheme. Wonderful.
I learn so much from your excellent posts and especially appreciate the humor you inject. “Hazel eating red pants!” Ha ha ha!
Keep up the amazing work and thank you for sharing your radio world with us!
Thomas
Aw..thank you for the kind words, Thomas! I wasn’t sure if that picture isn’t a bit too goofy, or if many people get the Simpsons reference. 🙂