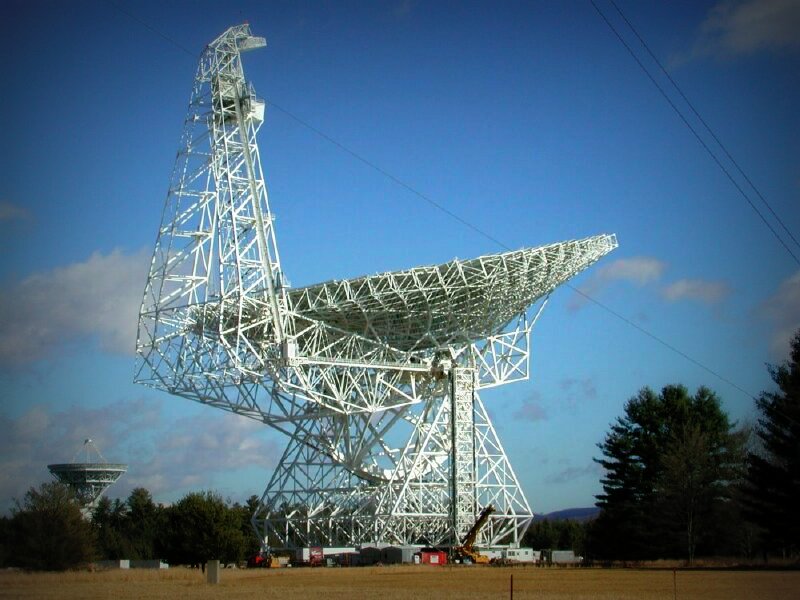
The Green Bank Telescope (Source: NRAO)
Many thanks to SWLing Post contributor, Ed, who shares a link to the following article at Breakthrough Initiatives:
Green Bank Telescope observations of a dwarf galaxy three billion light years away reveal 15 bursts of radio emission. This is the first time bursts from this source have been seen at these frequencies.
San Francisco – August 29, 2017 – Breakthrough Listen – the initiative to find signs of intelligent life in the universe – has detected 15 fast radio bursts emanating from the mysterious “repeater” FRB 121102. Fast radio bursts, or FRBs, are brief, bright pulses of radio emission from distant galaxies. First detected with the Parkes Telescope in Australia, FRBs have now been seen by several radio telescopes around the world. FRB 121102 was discovered in 2012, on November 2nd (hence its name). In 2015, it was the first FRB seen to repeat, ruling out theories of the bursts’ origins that involved the catastrophic destruction of the progenitor (at least in this particular instance). And in 2016, the repeater was the first FRB to have its location pinpointed with sufficient precision to allow its host galaxy to be identified. It resides in a dwarf galaxy about 3 billion light years away from Earth.
Attempts to understand the mechanism that generates FRBs have made this galaxy a target of ongoing monitoring campaigns by instruments across the globe. Possible explanations for FRBs range from outbursts from rotating neutron stars with extremely strong magnetic fields, to more speculative ideas that they are directed energy sources used by extraterrestrial civilizations to power spacecraft.
Breakthrough Listen is a global astronomical initiative launched in 2015 by Internet investor and philanthropist Yuri Milner and cosmologist Stephen Hawking. As part of their program to observe nearby stars and galaxies for signatures of extraterrestrial technology, the Listen science team at UC Berkeley added FRB 121102 to their list of targets. In the early hours of Saturday, August 26, UC Berkeley Postdoctoral Researcher Dr. Vishal Gajjar observed the location of FRB 121102 using the Breakthrough Listen backend instrument at the Green Bank Telescope in West Virginia. The instrument accumulated 400 TB of data on the object over a five hour observation, observing the entire 4 to 8 GHz frequency band.[…]
Analysis by Dr. Gajjar and the Listen team revealed 15 new pulses from FRB 121102. As well as confirming that the source is in a newly active state, the high resolution of the data obtained by the Listen instrument will allow measurement of the properties of these mysterious bursts at a higher precision than ever possible before.
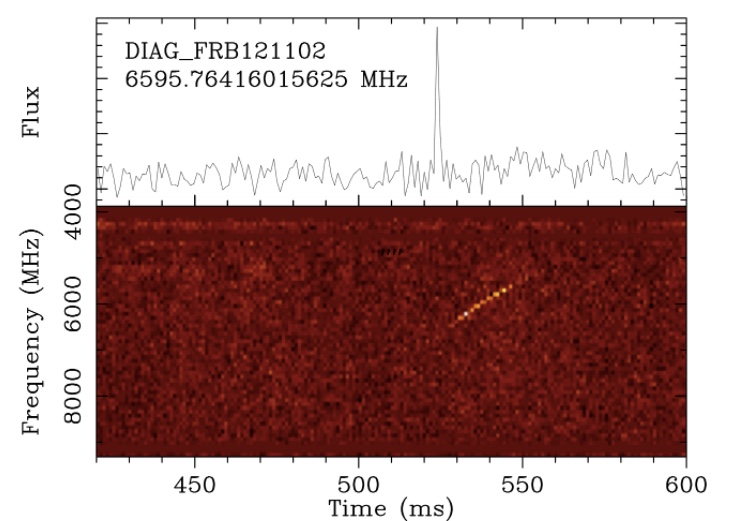
The observations also show for the first time that FRBs emit at higher frequencies (with the brightest emission occurring at around 7 GHz) than previously observed. The extraordinary capabilities of the Listen backend, which is able to record several gigahertz of bandwidth at a time, split into billions of individual channels, enable a new view of the frequency spectrum of FRBs, and should shed additional light on the processes giving rise to FRB emission.
When the recently-detected pulses left their host galaxy our entire Solar System was just 2 billion years old. […]The new results are reported as an Astronomer’s Telegram at www.astronomerstelegram.org/?read=10675 and will be described in further detail in an upcoming scientific journal article.
Breakthrough Listen is a scientific program in search for evidence of technological life in the Universe. It aims to survey one million nearby stars, the entire galactic plane and 100 nearby galaxies at a wide range of radio and optical bands.[…]
The linked animation shows 14 of the 15 detected bursts in succession, illustrating their dispersed spectrum and extreme variability. Capturing this diverse set of bursts was made possible by the broad bandwidth that can be processed by the Breakthrough Listen backend at the Green Bank Telescope:
https://storage.googleapis.com/frb121102/FRB121102_Cband_GB.gif
Click here to read the full article at Breakthrough Initiatives.