Many thanks to SWLing Post contributor, TomL, who shares the following guest post:
Recording Music on Shortwave
by TomL
I recently became curious about the seasonal music updates posted by Alan Roe. It is a nicely detailed list of musical offerings to be heard. Kudos to Alan who has spent the time and effort to make it much easier to see at a glance what might be on the airwaves in an easy to read tabular format. I do not know of any other listing specifically for shortwave music in any publication or web site. I especially like the way it lists everything in UTC time since I might want to look for certain time slots to record. For some listings, I would need to go outdoors away from noise to listen to certain broadcasts. Current web page is here: https://swling.com/blog/resources/alan-roes-guide-to-music-on-shortwave/ .
As a side note, I have also found a lot of music embedded in the middle of broadcasts that are unannounced, unattributed, and not part of a regular feature program. That can be a treasure trove of local music you might not be able to find anywhere on the internet. It can be worth recording a spectrum of frequencies using the capabilities of the SDR and then quickly combing through the broadcasts at two-minute intervals (most songs are three minutes or longer). In maybe ten minutes, I will have at least identified all of the listenable music that may or may not be worth saving to a separate file.
Whether at home or outdoors, I have wanted to try to record shortwave broadcasts of music using my AirSpy HF+ but never getting around to it until now. There is a certain learning curve to dealing with music compared to just a news summary or editorial. I found myself wishing I could improve the fidelity of what I was hearing. From static crashes, bad power line noise, fading signals, and adjacent channel interference, it can be quite difficult to get the full appreciation from the musical impact.
I am starting to monitor the stronger shortwave stations like WRMI, Radio Romania International, Radio Nacional do Amazonia, etc. These type of stations can be received in a strong enough manner to get good quality recordings (at least according to shortwave listening experience). I am also finding that I appreciate much more than before the effort that these broadcasters put into creating content/commentary to go along with the music and little pieces of background info about the music or the artist. I have also noticed how exact some broadcasters are in timing the music into the limited time slots. For instance, Radio Romania International tries to offer one Contemporary piece of music exactly at 14 minutes, Traditional music exactly at 30 minutes, and a Folk tune exactly at 52 minutes into the program (whether in English, French, or Spanish), with nice fade-outs if the music goes too long.
One thing I ran into was to bother checking my hearing range. If someone has impaired hearing, it does not make much sense to create files that have a lot of sound out of one’s hearing range. I found this YouTube video (among a bunch of others) and listened to the frequency sweep using my Beyerdynamic DT-990 Pro headphones (audiophile/studio type headphones). My hearing is approximately from 29 Hz through 14400 Hz. Of course, the extremes fall off drastically, and as with most people, my hearing is most sensitive in the 2000 through 6000 Hz range.
Recording Workflow
Let’s assume that you already know how to record IQ files using your SDR software and can play them back (In the example below, I recorded the whole 49 meter band outputting a series of 1GB WAV files). Then, when playing back to record to individual files, I have to choose the filters and noise reduction I want. This gets subjective. If I do not want to keep huge numbers of Terabytes of WAV files over time, I will want to record to individual WAV files and then delete the much larger spectrum recording. You might tell me to just record to MP3 or WMA files because there is that option in the SDR software. We will get into that as we go along. For the time being, I do not want to keep buying Terabytes of hard drives to hold onto the original spectrum recordings.
After lots of trial and error, I came up with this workflow:
- Record the meter band spectrum of interest using the SDR software.
- Record individual snippets of each broadcast in that spectrum to new individual WAV files. This includes not lopping-off any announcer notes about the music I want to retain. I also have to choose the bandwidth filter and any noise reduction options in the software. Because I am not keeping Terabytes of info, this is a permanent decision.
- Take an individual recording and apply more processing to it.
- Convert the processed recording to any number of final output formats for further consumption and/or sharing.
- Repeat steps 3 & 4 to take care of all the individual WAV files.
Step 4 allows me to create whatever file format I might need it to be: WAV, MP3, WMA, or even use it as background sound to a video if I so choose. There are also different ways to create some of these files with different quality settings depending on what is needed. I have chosen to listen to the individual WAV files for personal consumption but there may come a time to create high quality MP3 files and transfer those to a portable player I can take anywhere (or share with anyone).
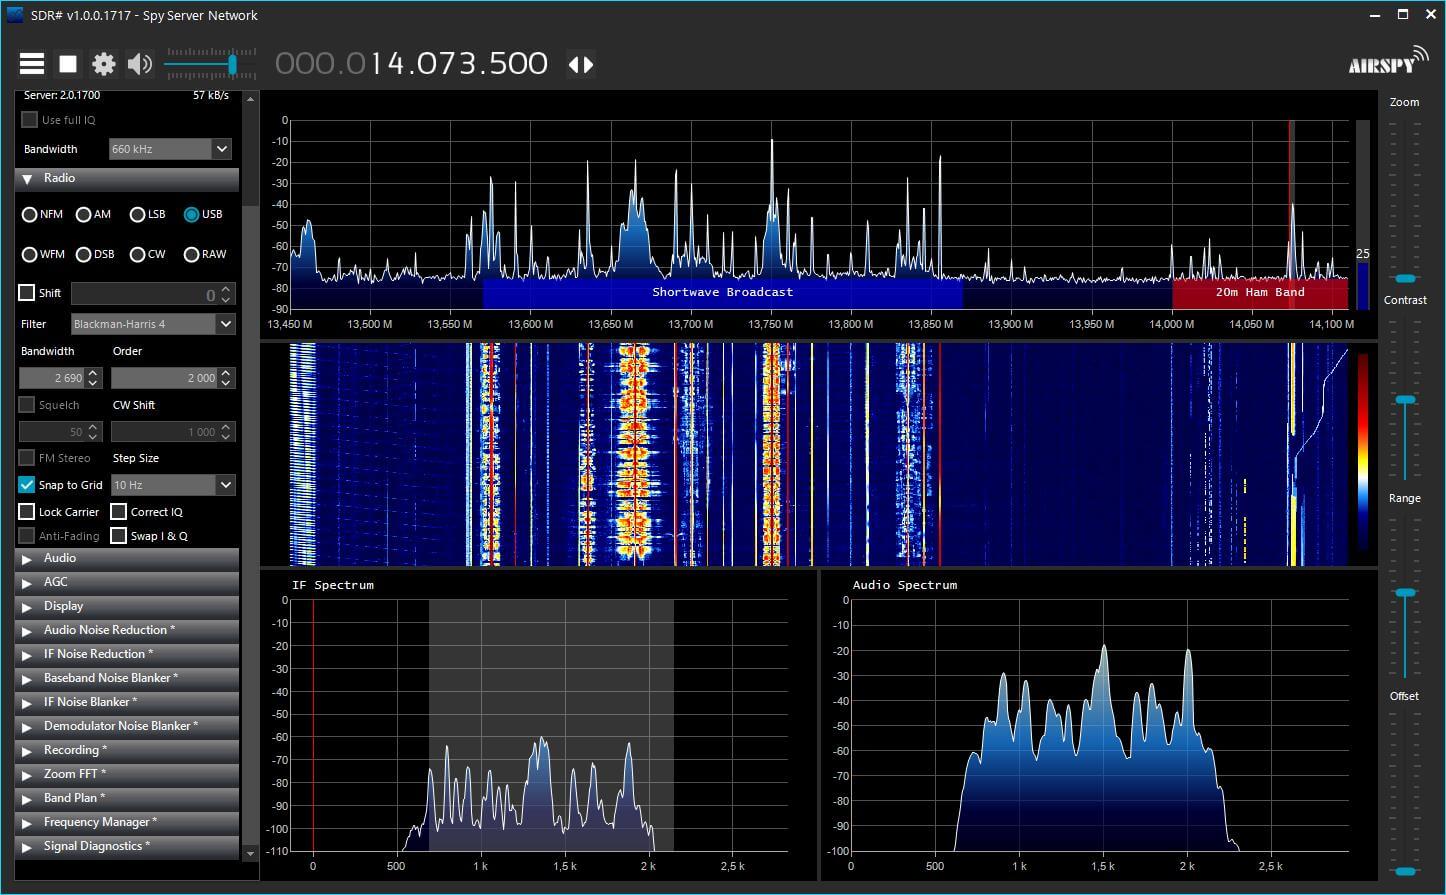
The example below is a snippet from the latest Radio Northern Europe International broadcast on WRMI. WRMI has some decent equipment and I like how clean and wide is the bandwidth of many of the music programs. This is captured on the AirSpy HF+ using SDR Console V.3 with a user-defined 12kHz filter (11kHz also seemed somewhat similar sounding).
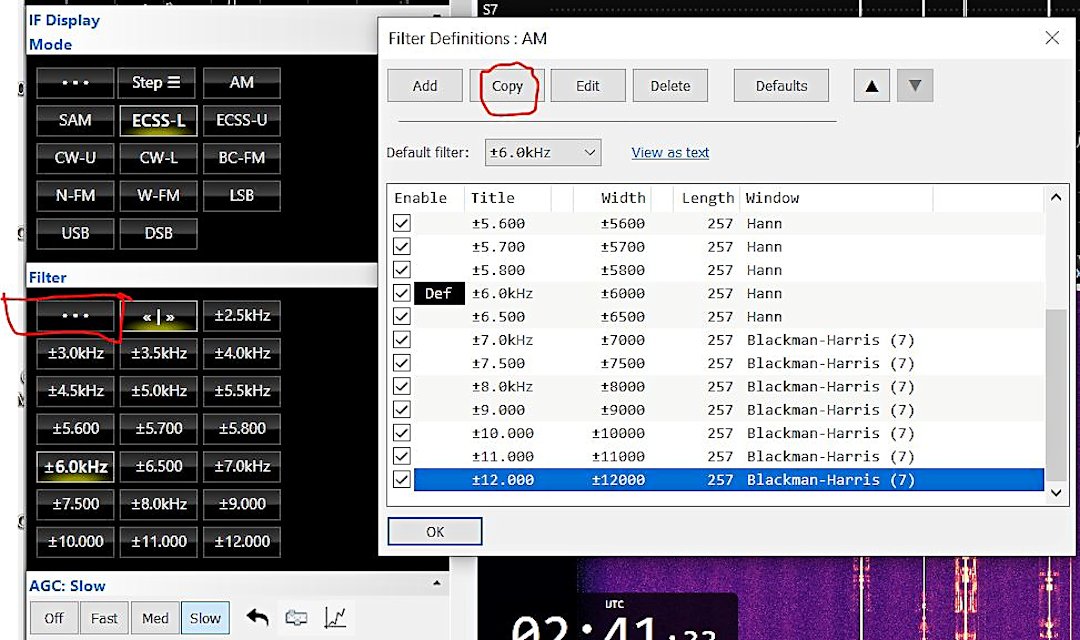
If you click on the ellipses, you can Copy an existing filter, type in a new title and change the bandwidth. I also played around with the different Windowing types and found that I like the Blackman-Harris (7) type best for music and the Hann type for smooth speech rendering (the Kaiser-Bessel types can also have more “punch” for voice recordings). Click OK TWICE to save the changes.
I also use Slow AGC and the SAM (Sync with both sidebands) to reduce the chance of distortion as the signal fades. I found that trying to use only one sideband while in Sync mode would make the reception open to loss of Sync with the musical notes warbling and varying all over the place!
Noise Reduction
The SDR Console software has a number of noise reduction choices. I tried NR1 through 4 and found the smoothest response to music to be NR1 with no more than 3 dB reduction. More than this seemed to muffle the musical notes, especially acoustic instruments and higher pitched voices. Part of the problem has to do with trying to preserve the crispness of the articulation of the sound and combating shortwave noise at the same time. At this time, I have chosen NOT to use any NR mode. More about noise reduction below.
Generic MP3 sounds really bland to my ears, so creating higher quality files will be important to me. I have been using Audacity which can apply processing and special effects to WAV files and export to any number of file formats. WAV files are a wonderful thing. It is a “lossless” file format which means that every single “bit” of computer input is captured and preserved in the file depending on the resolution of the recording device. This allows one to create any number of those “lossy” output formats or even another WAV file with special effects added. You can get it here:
One special effect is listed as “Noise Reduction”. I literally stumbled upon it while reading something else about Audacity (manual link). Here is how I use it for a shortwave broadcast. Open the original spectrum recording (in this example the 49m band). Tune about 25kHz away from the broadcast that was just recorded. Remember, my hearing extends at least to 14.4k plus there is still the pesky issue of sideband splatter of bandwidth filters. The old time ceramic and mechanical filters use to spec something called “skirt selectivity” -60db or more down from the center frequency. This is still an issue with DSP filters even though they SAY they are measured down to -140dB; I can still hear a raspy sideband splatter from strong stations!
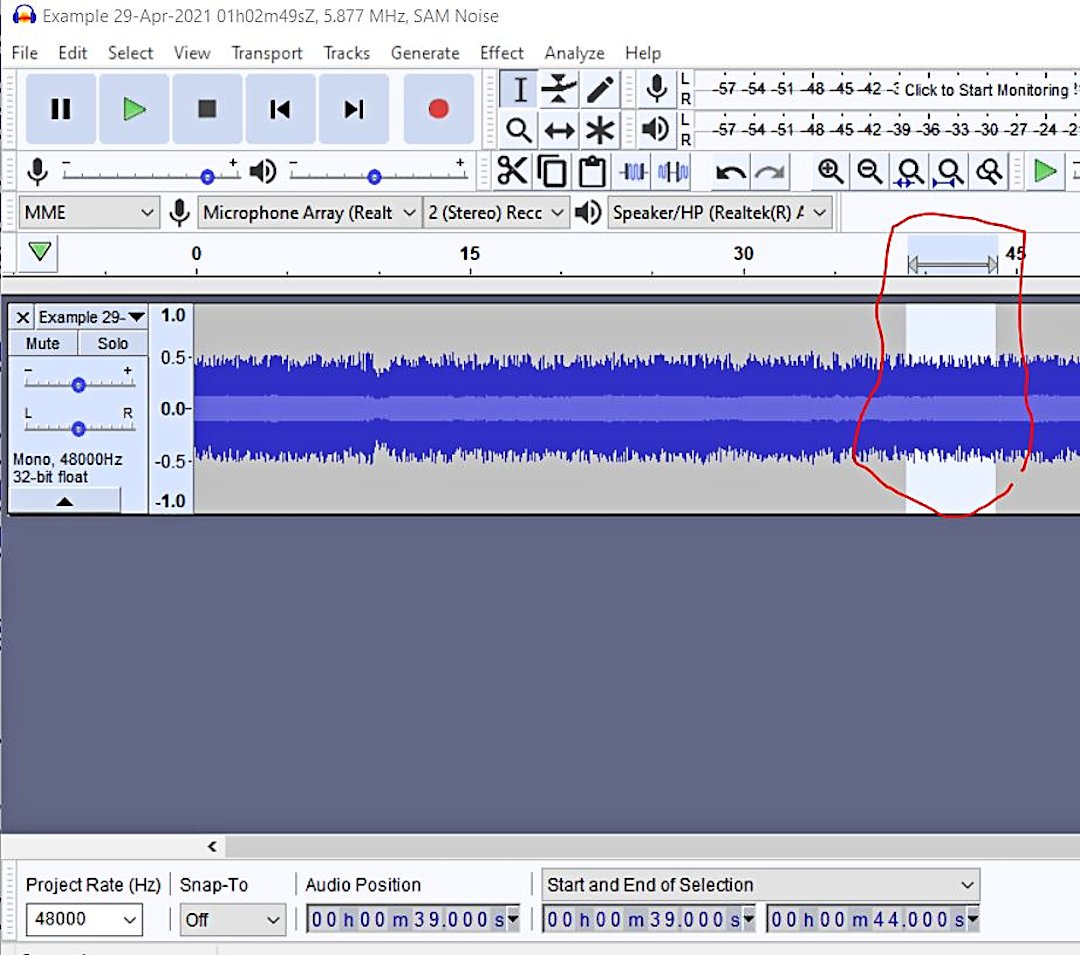
Find the same time frame that you recorded the broadcast and make sure it is the same bandwidth filter, AGC, and any noise reduction used. Now record one minute of empty noise to a WAV file. Fortunately on 5850 kHz, WRMI has no adjacent interference.

Now in Audacity, open the noise sample and listen for a 5 to 10 second space to copy that is relatively uniform in noise. We don’t want much beyond that and we don’t really want noise spikes. The object is to reduce background noise. In this case, I chose Start 39 seconds and End 44 seconds. Choose Edit – Copy (or CTRL-C).
Choose File Open and find the broadcast WAV file in question. Now click on the end-of-file arrow or manually type in the Audio Position (in this example 1 minute 15 seconds). Now Paste (or CTRL-V) the 5 seconds of noise to the end of the broadcast file. Now, while the pasted noise is still highlighted, go immediately to Effect – Noise Reduction and choose the button Get Noise Profile. It will blink quickly to read the highlighted 5 seconds of noise and disappear.
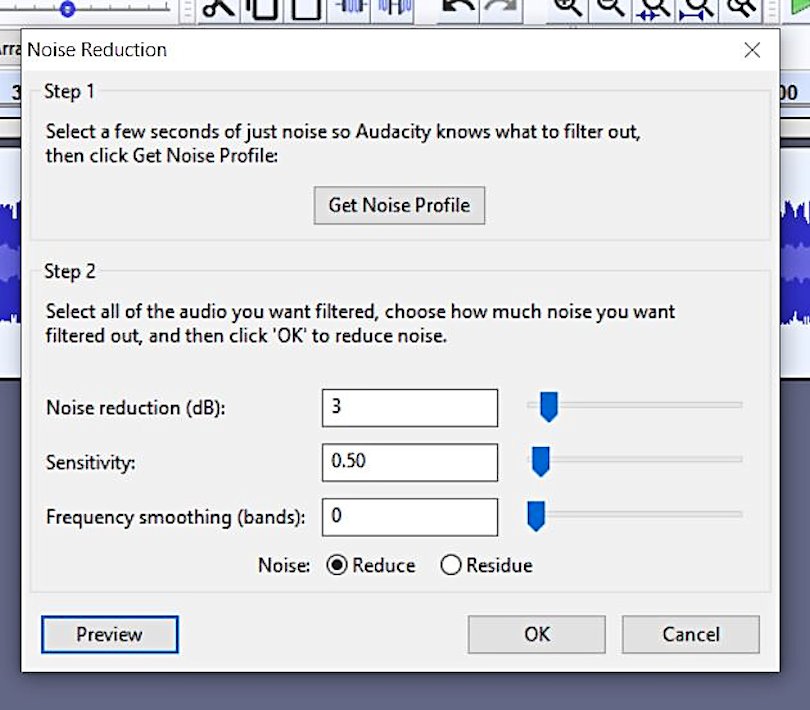
Now select all with CTRL-A and the whole file is selected. Go immediately to Effect – Noise Reduction and choose the parameters in “Step 2”. Through some trial and error, I found 3db reduction has a noticeable effect without compromising the music. I have used up to 5 db for some music recorded with narrower bandwidths. Higher levels of noise reduction seemed to create an artificial flatness that was disturbing to me. I also use a Sensitivity of 0.50 and Frequency smoothing of 0. You can choose the Preview button while the Residue circle is checked to actually hear the noise being eliminated. Press OK in order to process the noise reduction. You should now see the waveform change slightly as the noise is filtered. In a nutshell, I find this to be a better noise reduction than using 3db of NR1 in the SDR Console software. Don’t forget to snip off those 5 seconds of noise before saving the file.
Pseudo Stereo
The SDR Console software has an Option for Pseudo Stereo (for playback only) and it can be useful for Amateur Radio receiving, especially in noisy band conditions when one is straining to hear the other person’s call sign and location. There is a way in Audacity to add a fake kind of stereo effect to mono audio files. I found a useful YouTube video that explained it very clearly.
I do everything listed there except for the Reverb effect. I find that too fake for my tastes.
I found the added 10ms of Delay on the right channel to be a little too much, so I use 9ms.
My High Pass filter settings are 80 Hz and 24dB/octave. This is based partly on my hearing preferences as well as established industry standards. There was a lot of science and audio engineering that went into creating the THX home theater crossover standard. There is also science that says that anything below 200 Hz is omnidirectional. The suggested 48dB/octave is too steep in my opinion.
My Low Pass filter settings are more squishy. The YouTube video suggests 8000 Hz and 6dB/octave. I feel that is too gentle a rolloff into the upper midrange. I use 9000 Hz at 12dB/octave for very strong, high quality shortwave broadcasters like WRMI. For more constrained quality broadcasts, like due to limited bandwidth (Cuban broadcasters) or adjacent channel interference, I will decrease down to 8000 or 7000 Hz but still use a 12dB/octave rolloff. This is subjective but it also means I am making a conscious decision to add that processing to the recording for future listening.
MP3 Quality
Typical MP3 files are a Constant Bit Rate of 128k. Some interviews and voice-only podcasts are only 64k. This is adequate but for recording detail in the music I prefer higher quality settings. Frankly, with these days of 4G cell phone service and Unlimited Data minutes on cell phone plans, there is NO good reason to limit MP3 files to just adequate quality levels. The typical MP3 file sounds limited in frequency range (muffled sounding) to me and very lacking in dynamic range (narrow amplitude). This would include limits on stereo files which are about twice the file size of mono files.
I have tried creating WMA files and I actually like the quality a little better than high quality MP3 files. The WMA files seem slightly more “airy” and defined to my ears. But it is a proprietary format from Microsoft and not all web sites or devices will easily play them. They are also a fixed standard and one cannot easily change the quality settings if forced to use a lower quality rendering.
There are many web sites talking about MP3 files, but I found this blog post helpful in summarizing in one paragraph the higher quality settings for a nice MP3 recording using VBR-ABR mode.
https://technical-tips.com/blog/software/mp3-encoding-right–1334
One Minute Samples
So finally for my examples. Since most web sites still prefer MP3 files, I have created these using that blog post’s suggestions. Typically this is Min bitrate=32, Max bitrate=224, VBR quality=9, and Quality=High (Q=2). Let’s see if you can hear the differences. It would be much easier to hear if we were listening to WAV files, but those are way too big to post on this web site! The software I used is Xmedia Recode and I find it easy to use.
https://www.majorgeeks.com/files/details/xmedia_recode.html
Example 1: No noise reduction in SDR Console, no further processing
Example 2: 3dB of NR1 in SDR Console, no further processing
Example 3: No noise reduction in SDR Console, Audacity Noise Reduction of 3dB
Example 4: No noise reduction in SDR Console, Audacity Noise Reduction applied 3 times (3db,0.33+2db,0.50+1db,0.80)
Example 5: No noise reduction in SDR Console, Audacity Noise Reduction applied 3 times (3db,0.33+2db,0.50+1db,0.80), Pseudo Stereo added
I would love to hear comments since I am new to recording music on shortwave and any further tips/tricks would be fun to learn. Enjoy the music!
TomL