Many thanks to SWLing Post contributor and supporter, Bob Raymond with DXtreme who shares the following product announcement:
 Product Announcement
DXtreme Monitor Log 14™
DXtreme Software™ has released a new version of its popular logging program for radio and TV monitoring enthusiasts: DXtreme Monitor Log 14. Its familiar, uncluttered, industry-standard Windows® interface lets listeners and DXers log the stations they’ve heard using features that enhance their monitoring enjoyment.
New Features in Version 14
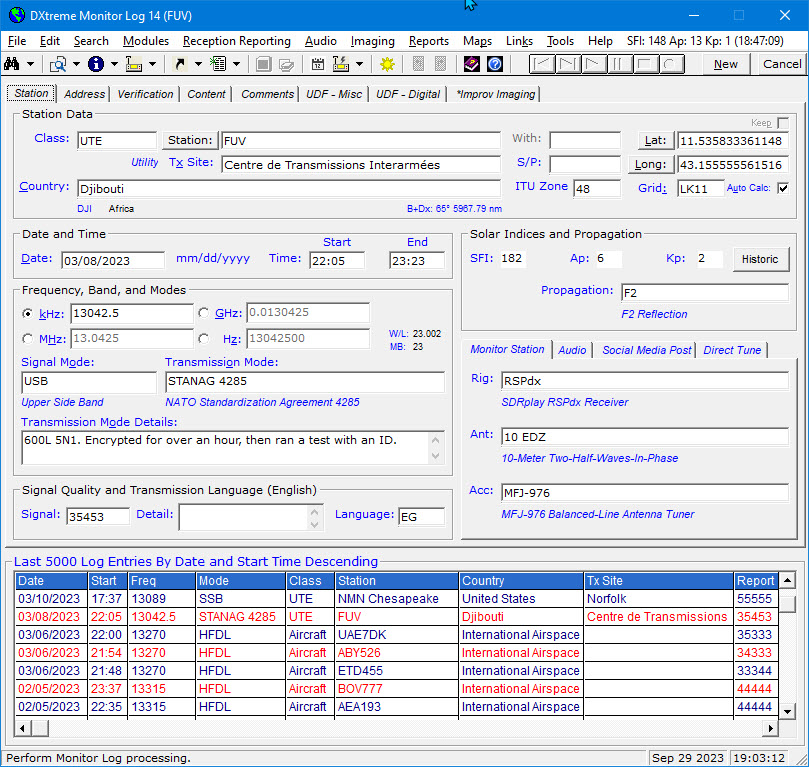
Signal Modes, Transmission Modes, Grid Square Tracking
- We added a Signal Modes field to let users specify the signal mode their receiver is tuned to (for example, AM, CW, FM, LSB, USB, RTTY, etc.) plus a Transmission Modes field to let users specify the transmission mode the station is transmitting (for example, CW, FAX, FT8, HFDL, MIL-STD-188-141A, SSB, STANAG 4285, etc.). And we added Signal and Transmission Mode modules to let users maintain tables of signal and transmission modes.
- We added a Transmission Mode Details box to allow users to type free-form information about the transmission mode received, such as baud rate, bandwidth, etc. (for example, 1200bps/L). New Log Variables enable users to share Signal, Transmission, and Detail mode information so readers (and users) can reproduce the monitoring environment and log (or relog) the stations. Here are two examples: “1200bps/L STANAG 4285 crypto tfc on USB” and “MIL-188-110A/B continuous mode idle on LSB.”
- We added support for tracking Maidenhead grid squares, which is useful when monitoring/logging stations not located in traditional countries, like aircraft and ships operating in international airspace and waters. Grid squares are calculated from specified latitudes and longitudes. Both Performance and Stations reports let you track grids. Search functions let you find log entries for viewing or editing based on their grid squares.
Verification By Improv Imaging
Similar to the legacy Verification By Audio feature, where the presence of an audio file in a log entry designates the station as “Verified By Audio,” we added a Verification By Improv Imaging feature which counts the station as “Verified By Improv Image” if the Shows ID check box on the Improv Imaging tab is selected, indicating the presence of an ID on the window of a captured digital software application (such as PC-HFDL). Performance, Stations, and Log Entries reports let you track verifications by traditional QSLs, presence of Audio files, and presence of Improv Images for which the Shows ID check box is selected.
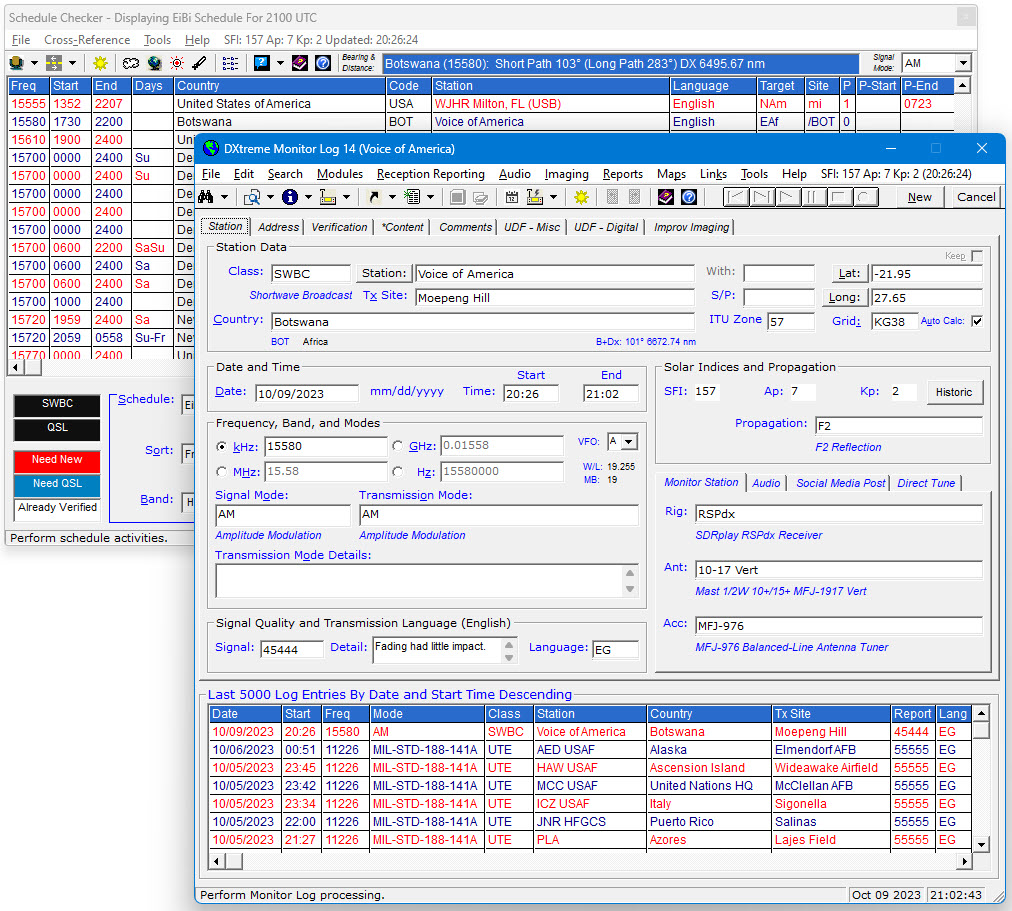
Schedule Checker Monitoring Advice and Tuning
- When Schedule Checker advises users to monitor a station for a new or verified Country, it does so now for the Class (SWBC, Ute, Ham, etc.) and QSL Type (Verified By QSL, Audio, or Improv Image) selected in Properties. The foreground and background colors that indicate the Schedule Checker’s monitoring advice can be defined by users in Properties. The colors appear in an upgraded legend on the Schedule Checker.
- Users can now tune their radios to the schedule item’s signal mode and frequency by selecting the desired signal mode in the Signal Mode list box and double-clicking the schedule item.
Solar Indices Enhancements
- Acquisition of current solar indices has been improved on the Monitor Log and Schedule Checker windows. • Editing of solar indices has been added to the Monitor Log window for when NOAA is down.
- We restored historic solar indices adjustments based on date and time changes made on the Monitor Log window provided users have downloaded historic solar indices from the NOAA FTP site into the Solar subfolder. An interface is provided on the Edit menu of the Monitor Log window for this FTP activity.
For more information about New Features, click https://www.dxtreme.com/monitorlog_whatsnew.htm.
Standard Features
Logging Stations
Monitor Log 14 lets users log all kinds of stations: radio, television, broadcast, utility, Amateur Radio, military, etc. across the radio spectrum.
Finding Stations to Monitor
The Schedule Checker lets users import schedules from Aoki, EiBi, and FCC AM web sites and display broadcast schedule data according to the filter criteria they specify. Users can filter schedule information by band, frequency, station, country, time of day, language, and more. EiBi schedules also include utility stations.
For each schedule item, Schedule Checker queries the Monitor Log 14 database to let users know – through user-defined, foreground and background display colors – whether they need to monitor a station for a brand new or verified country. The colors appear in a legend on the Schedule Checker window. When Schedule Checker advises users to monitor a station for a new or verified Country, it does so for the Class (SWBC, Ute, Ham, etc.) and QSL Type (Verified By QSL, Audio, or Improv Image) selected in Properties.
Reporting Reception
Users can create customized paper and e-mail reception reports for sending to stations plus log entry data shares for reporting catches to clubs and magazines. Using the Script Editor window, users can create and edit scripts that format reception reports, eReports, and shares to their liking. The software prompts users to select the script they want to use. Dozens of scripts come with Monitor Log 14. Users can also send eQSL requests to hams automatically via the popular https://www.eqsl.cc site and update their databases with downloaded eQSL.cc Inbox records.
Imaging
Improv Imaging lets users associate ad hoc images with log entries using Capture, Scan, and Clipboard functions. Captures of stations received on digital applications, waterfall displays, facsimile and Amateur TV pictures are popular. The Improv Imaging tab and Application let users view images anytime, and an Improv Image Explorer lets them peruse their entire collection and display associated log entries. A QSL Imaging facility functions the same as Improv Imaging for associating QSLs.
Other Features
- Rig Control — Retrieves the frequency and mode from supported radios and permits tuning from the Schedule Checker and Direct Tune. Rig control is provided through integration with Afreet Omni-Rig (http://www.dxatlas.com) and CAT for SDR applications like SDR Console (https://www.sdr-radio.com) and SDRuno (https://www.sdrplay.com).
- Audio Archiving — Lets users maintain an audio archive of stations heard.
- Reporting and Searching — Produces Performance, Stations, and Log Entry reports that track the performance and progress of the user’s monitoring station and provides criteria-based log entry searches.
- Documentation — Context-sensitive Procedural Help, Field Help, and Microhelp are accessible on every window to provide instructions quickly. Installation Instructions and a Getting Started Guide also included.
Supported Operating Systems, Pricing, Contact Information
DXtreme Monitor Log 14 runs in 32- and 64-bit versions of Microsoft® Windows® 11, 10, 8.1, 8, 7, Vista® XP. Retails for $94.99 USD for Internet distribution (discounted pricing for upgrades available). Product support by Internet e-mail. For more info, visit (https://www.dxtreme.com) or write [email protected].
SWLing Post readers should note that DXtreme was one of our first company supporters. Their ad revenue helps bring the SWLing Post to you daily. Thanks, DXtreme!
Click here to check out DXtreme Monitor Log 11.