Category Archives: AM

Armed with loops, fences, and an Icom IC-705, 13dka battles transatlantic MW DX

Many thanks to SWLing Post contributor, 13dka, who shares the following guest post:


Dipping my toes into transatlantic MW DX

by 13dka

Most of my SWLing life I wanted to dig into MW DX but never managed to make that really happen for some reason. Then last November, I fetched my first transatlantic station while I wasn’t even trying, in a rather surprising setting:

I have to explain that my home and neighborhood got so infested with a multitude of QRM sources that I did not put my outdoor antennas back up after a storm blew them out of the trees in winter 2018/19. I just used an ML-200 loop indoors, which also has to put up with my own additional QRM sources in my den, consisting of 3 computers running 24/7 and a couple of switching power supplies, a TV, LED lighting… allowing for very basic reception as long as my neighbors don’t watch TV or use the internet. On top of that, medium wave is badly beaten by a mowing robot’s boundary wire here, making reception on several portions of the band completely impossible.

I never expected receiving any US stations on MW in that noise, but I couldn’t sleep that night and scanned the bands a bit with the IC-705 hooked up to my new YouLoop hanging over my bed for testing. I had seen the characteristic transatlantic carriers on MW many times before on my SDRs, but for some reason I never picked up anything intelligible on them in any winter season, now a lot of these carriers were there again but on 1130 there was actually modulation and it wasn’t the only station!

Small bedside loop: SWL’s dreamcatcher!

Bloomberg Radio 1130 came in with almost enjoyable quality at times, but Bloomberg is also kind of a surefire station for MW DX over here. I also picked up a station on 1120 and another one on 880 which was briefly so strong that it surmounted the strong interference from BBC Radio Wales on 882 kHz. 1120 was confirmed the next night to be KMOX in St. Louis, 880 kHz was *not* KCBS in NY – I checked that immediately, I have a KiwiSDR set to that frequency booknarked on my cellphone in case I have a craving for the 1-877-Kars-4-Kids commercial. Powerwise likely candidates for that would be CHQT (50kW) in Edmonton, CKLQ (10kW) in Manitoba or KRVN in Nebraska (50kW class B station) but this may be hard to verify due to the dominance of the BBC on that frequency. Anyway, KMOX wasn’t a bad catch for a small, passive indoor loop, that’s 7,150km or 4,440 miles from here!

Bloomberg Radio on the YouLoop:


Here’s KMOX:


This was A) quite encouraging for nighttime DXpeditions to the dike (brrr…cold!), B) a testimony for the YouLoop’s good performance on MW and C) a testimony for the IC-705 having pretty much all one could wish for in a capable MW DX radio – notch filter, passband tuning on AM, stable ECSS, waterfall display to detect stations and last but not least loads of sensitivity to make the most out of low-output antennas down on MW.

Going to the dike

Of course I just had to put on some long johns and drive to the dike around 3:00am local a few nights later, to try my luck with my ML-200 (lacking a better idea) with an 80cm diameter rigid loop. I was mildly surprised that reception wasn’t that much better than with the YouLoop at home. The overall yield wasn’t exactly outstanding compared to other people’s logs but a lot of stations were hidden in the frequency ranges that are submerged in QRM at home. My log has US/Canadian stations on 20+ different frequencies, unfortunately most of them UNID. Here are some recordings I made that night, hunting for unambiguous station IDs from North American broadcasters:

ML-200, Nov. 16th, 2020

1130 Bloomberg Radio on the ML-200:


Presumedly WABC 770 in NYC: In MW DX, never think you ID’d something properly just because you heard a city name and the frequency has a clear-channel station located there!


This is more unambiguously 1010 WINS in NYC (with a twist described later)


1030 WBZ Boston, MA – the first part of the clip is showing how it sounds when the signal is good, the second part demonstrates how reliably propagation is taking a rest while a station identifies itself.


The grandpa of AM broadcasting, 1020 KDKA:


Moving away from the east coast, this is WHAS 840 in Louisville, KY:


760 WJR Detroit, MI


Here’s a tough one, the religious content I heard with a great signal before doesn’t warrant a proper ID alone, and as per usual the station ID’d while fading out. I could ID this only with a set of big, closed headphones, which is a mandatory accessory for all extreme DX (CHRB 1140 in High River, Alberta):


Of course I was occasionally checking other bands too and got some serviceable signals from Brazil:

Clube do Para on 4885 kHz:


VOA Pinheiro from Belem, Brazil on 4960:


Going to another dike, this time it’s personal!

Time to try something completely different: A ~1,000m/3,000′ straight (and preliminary considered continuous) stretch of mesh fence along the dike heading ~345° (NNW), pointing roughly to mid-/western mainland North America. I had briefly tried its aptitude for being a “natural” Beverage antenna before – with mixed but encouraging results: Due to the fence not being terminated at the far end it may be kind of bidirectional, and according to my latest insights a Beverage style antenna doesn’t work well over very good (conductive) ground, probably even less so close (maybe 200′) to the ocean. Also, I forgot to pack the 9:1 balun I prepared for that purpose, so I just had some wire with alligator clip to connect the fence to the radio. Boo.

Accordingly, what I saw on the waterfall display didn’t look so much different than what I got from the ML-200 before – there were clearly more stations visible (as a carrier line on the waterfall) but nothing was really booming in. However, I managed to log a few more stations, such as WRKO in Boston and (the highlight of the night) 1650 KCNZ “The Fan” in Cedar Falls, IA which has only 1kW to boot at night to make the 6,940 km/4,312 mi to my dike. This may or may not be an indication that the “Beverage sheep fence” isn’t so bad after all!

“Fence”- reception, Nov. 18th, 2020:

VOCM 590, St. Johns, New Foundland, Canada’s easternmost blowtorch is like Bloomberg an indicator station for European MW DXers:


680 WRKO, Boston, MA:


1040 kHz, presumed to be WHO, Des Moines, IA: No ID, only a matching frequency and a commercial for “Jethro BBQ”, which has locations only in and around Des Moines:


Here’s 1650 KCNZ, Cedar Falls, IA with 1KW:


To put that into some relation, this is what 1KW sounds like on a very quiet 40m band in SSB (K1KW from Massachusetts on 7156 kHz producing a 9+20 signal that morning on the “Fence antenna”):


BTW, interesting bycatch – not the first time I caught WWV and WWVH on the same frequency but that morning was the first time I could hear both on 5 MHz:


So where have you been all my life, American AM stations?

A question remains – how could I miss the existence of these stations forever, then in modern SDR times see the carriers on the spectrum scope and still miss the modulation on these carriers? Or the other way around – why did I hear them now?

To begin with, when I started out with the radio hobby many decades ago, the reason for the occasional whine and whistle on some stations (particularly past midnight) wasn’t obvious to me: The last thing I suspected was that this could be interference from across the pond, with the pitch of the whine (or “het”) having a direct relation to the 9kHz vs 10kHz difference in channel spacing. Of course these stations were there all my life! Then, with just some regular radio you’d have to pick one of very few frequencies where a strong station from across the pond coincides with a nice silent gap in the local channel allocation. But until this millennium, European medium waves had no such gaps and a lot more local blowtorches.

Since that time many MW stations were turned off and demolished and whole countries abandoned MW here in Europe, so we’re in a much better spot now for transatlantic DX. Unfortunately the opposite is true for listeners on the left side of the pond, you guys still have a very crowded AM band but less potential DX targets in Europe. On the bright side, the remaining European stations are often not restricted to 50kW and you have another ocean with very distant and rewarding DX stations that are very, very hard to catch in Europe!

Wrong time, wrong place

Another bunch of factors are – of course – propagation, season and location/latitude. The MW DX season is roughly fall to spring nights (when TX and RX are in the dark) with a period of increased absorption in the middle (the “mid-winter anomaly”), signals are potentially stronger at lower latitudes and weaker at higher ones but the distance to the noisy equator and a lack of stations interfering from the N can be a huge advantage for using over-the-pole paths on higher latitudes. The big showstopper is solar activity: Good condx on shortwave can be rather bad for skywave propagation on medium wave, so a solar minimum is the long-term hotspot for (transatlantic) medium wave DX.

I’m glad that I learned how intense that relationship is right away: When I discovered that Bloomberg is pretty good on my indoor YouLoop at home, condx were pretty down with SFI in the low 70s and very little excitement of the auroral zones. 2 weeks later the SFI was only slightly higher in the 80s-100, many of the carriers were missing on the waterfall and Bloomberg could be heard only in much bigger intervals.

Speaking of which – even with favorable condx, a proper radio and a half-proper antenna, patience is key! In my very fresh experience the fading cycles on those over-the-pond signals are long! So far I have seen everything fading in and out over the course of a few minutes to half hours or more, with less favorable conditions or a worse antenna it may take much longer until it sticks out of the noise for a while. So you may have to park on a frequency for a long time to not miss the station coming up so much that it becomes readable at the right time to ID it. Multiple DX stations on the same channel can make identification difficult unless one station really dominates the other and that all may take hours or days until it happens. Here’s a lucky example on 1010 kHz:

Lucky because in this case one station is already known – it’s WINS but it often has another station underneath and I was curious what that station might be. On this occasion, the station ID’d itself as “Newstalk 1010” (which is CFRB in Toronto, 0:05 in the clip) just in a short talking break on WINS. Again, this can’t be heard on my laptop speakers but on headphones:


Waiting for a moment like this to happen isn’t exactly fun, that’s why spectrum recordings are incredibly valuable particularly on MW – you won’t miss a possible station ID on frequency A because you were listening to frequency B, but a part of me thinks this is taking a bit of the challenge away, like blast fishing. 🙂

Fancy equipment

The IC-705 fits snuggly-wuggly into my steering wheel for extra-comfy tuning!

Fun fact: While Bloomberg NY on 1130 was (kind of) booming in at home so I knew for sure it was there, I could hear it even on the XHDAtA D-808 with its tiny loopstick and only average sensitivity on the AM band! So for “easy”, loud and undisturbed stations some persistence and a simple portable radio may suffice to catch some transatlantic DX. But most of the stations will be hit by interference from closer stations, then the radio needs at least to be capable of stable sideband reception, with a corresponding narrow filter and proper suppression of the unwanted sideband – luckily this isn’t an unusual feature on inexpensive portables anymore. So if you already have an SSB capable radio that’s all you need to address the most common issue with transatlantic DX, US and EU stations being too close in frequency. Of course passband tuning and notch filters are most helpful assets in a radio for this, rescuing reception in even more severe interference situations and the spectrum/waterfall display on an SDR helps a lot with finding the carriers and SDRs also have all the nice tools but with some more patience you may find stations with many conventional receivers.

Of course antennas are the crucial component again: If conditions are excellent, even a loopstick may bring the first stations into the log, some small magnetic (wideband) loop could dig up some more stations, from there it’s quickly going a bit esoteric – AFAIK there are no commercial offers for multi-turn (tuned) loop antennas nor are FSL antennas easy to come by, you can’t buy EWE et al antennas either and Beverage antennas for MW are quite a project – not that hard to get a kilometer of wire and there are even kits to buy but it could be much harder to find a place to roll it out in the direction you’re interested in, in an area that doesn’t have electric fences or high voltage power lines within a radius of at least several miles. I guess once you become addicted, you’ll stop asking yourself whether or not it’s worth the effort.

So it’s pretty clear what happened: For catching TA DX stations, the ionospheric conditions must be good, to receive that with a loopstick they must be ideal and that’s what they are currently – it’s winter in what’s still a deep solar minimum and on top of that, some of my radios are very apt for MX DX and I was lucky to listen on the right time on the right frequency. When I started writing this article, my enthusiastic bottom line was supposed to be something like “MW DX isn’t rocket science”, which is certainly true but I think my history with it shows that it’s not exactly trivial either. Maybe that’s why it’s so rewarding, it sure is some hardcore DX challenge that complements the shortwave activity quite nicely and may give you something to look forward to when solar activity is down.

Spread the radio love

Guest Post: Using Carrier Sleuth to Find the Fine Details of DX

Many thanks to SWLing Post contributor, Nick Hall-Patch, for sharing the following guest post:


Using Carrier Sleuth to Find the Fine Details of DX

by Nick Hall-Patch

Introduction 

Medium wave DXers are not all technical experts, but most of us understand that the amplitude modulated signals that we listen to are defined by a strong carrier frequency, surrounded on either side by a band of mirror image sideband frequencies, containing the audio information in the broadcast.

Most DXers’ traditional  experience of carriers has been in using the BFO of a receiver, using USB or LSB mode, and hearing the  decreasing audio tone approaching “zero beat” of the receiver’s internal carrier compared with the DX’s carrier frequency as one tuned past it.  This was often used as a way of detecting that a signal was on the channel, but otherwise wasn’t strong enough to deliver audio.  Subaudible heterodynes,  regular pulsations imposed on the received audio from a DX station, could indicate that there was a second station hiding there, with a slightly different carrier frequency,  And, complex pulsations, or even outright low-pitched tones could indicate three or more stations potentially available on a single channel.

With the advent of software defined radio (SDR) within the last 10 years or so, the DXer has also been able to see a graphical representation of the frequency spectrum of the carrier and its associated sidebands.  (Figure 1)  Note that the carrier usually remains stable in amplitude and frequency, unless there are variations introduced by propagation, but that the sidebands are extremely variable.

Figure 1

Figure 2

In addition, by looking at a finer resolution of the SDR’s waterfall display, one might see additional carriers on a channel that are producing heterodynes (audible or sub-audible) in the received audio (Figure 2).  Generally speaking, a DX signal with a stronger carrier will be more likely to produce readable audio, although there are exceptions to that rule.

Initially, DXers wanted to discover the exact frequency of their DX, accurate to the nearest Hertz.  Although only a small group of enthusiasts were interested, they have produced a number of IRCA Reprints (https://www.ircaonline.org and click the “Free IRCA Reprints” button) over the years under the topic of “precision frequency measurement” (e.g. T-005, T-027, T-031, T-079, T-090) describing their use of some reasonably sophisticated equipment for the day, such as frequency counters.

So, why would this information be at all important?  In effect, the knowledge of the exact frequency of a carrier was used to provide a fingerprint for a specific radio station.    Usually, this detail was used by DXers who were trying to track down new DX, and wanted to determine whether a noisy signal was actually something that had been heard before, so would not waste any more time with it.  The process of finding this exact frequency has since been made much easier by being able to view the carrier graphically in SDR software, assuming that the SDR has been calibrated before being used to listen to and record the DX.   Playing back the recorded files will also contain the details of the exact frequency observed at the time of recording.  And, because the exact frequency of DX has become much easier to determine using SDRs, more and more DXers seem to be using this technique.

At present, Jaguar software for Perseus is the one being used by many to determine frequency resolution down to 0.1Hz, both in receiving and in playback.   But, if you have recorded SDR files from hardware other than Perseus, it is possible to get that resolution also, using software called Carrier Sleuth, from Black Cat Systems, available for both Mac and Windows, at a cost of US$20.

This software will presently take as input, sets of RF I/Q files generated by SpectraVue, SdrDx, Perseus (which includes files recorded by Jaguar), Studio One / SDRUno, Elad, SDR Console, and HDSDR.  It then outputs a single file with a .fft extension, that provides the user with a set of waterfalls, similar to those displayed by SDR programs.  The user decides ahead of time which frequency or set of frequencies (including all 9kHz or all 10kHz channels) will be output, and these will be displayed as individual waterfalls. one for each chosen frequency.  These waterfalls can be stepped through from low frequency to high frequency, or chosen individually from a drop down menu.

Let’s start by looking at a couple of output waterfalls and work out what can be done with them, then step back to find out how to generate them, and what other data is available from them.  Finally, we’ll do a quick comparison with two other programs that can produce similar output, and discuss the limitations in all three programs.

Example outputs from Carrier Sleuth

An example showing the original intent of Carrier Sleuth, determining precise carrier frequencies, is shown in Figure 3, a waterfall from 1287kHz on the morning of 28 November 2020.  At 1524UT, a woman mentions “HBC” and “Hokkaido” in the original recording, so, it’s JOHR, Sapporo.   Although there are a number of vertical lines representing carriers in this graphic, only one has a strong coloration, indicating at least 25dB more strength than any other carrier at the time of the ID, and about 50dB more than the background level.     The absolute values of time, signal strength, and carrier frequency precise to 0.1Hz, can be found by mousing over the desired point in the waterfall and then reading the numbers in the upper right corner of the display, (encircled in Figure 3).  In this case, the receiver’s reference oscillator had been locked to an accurate 10MHz clock, disciplined by GPS, so the frequency indicated in the software is not just precise, but should also be accurate.   Similar accuracy could be obtainable by the traditional method of calibrating the SDR to WWV on 10 or 15MHz.

Carrier Sleuth indicates 1287.0002kHz, within 0.1Hz of that observed by a contributor to the MWoffsets list about 7 weeks earlier (https://www.mwlist.org/mwoffset.php?khz=1287). If you look closely, there is a slight wobble on the frequency, but the display is precise enough that it can indicate that, despite the wobble, JOHR does not wander away from that frequency of 1287.0002kHz.

Figure 3

But let’s face it, tracking carriers to such accuracy is a specialist interest (though admittedly, the medium wave DXing hobby is full of specialist interests, and this one is becoming more mainstream, at least among Jaguar users).  However, if I played back a file from another morning, and found a strong carrier on a slightly different frequency from 1287.0002kHz, it might be an indication that some new Chinese DX was turning up, and that the recorded files would be worth a closer listen at that particular time.

Figure 4

In fact, I’ve found Carrier Sleuth to be useful in digging out long haul DX after it’s been recorded, as both trans-Arctic and trans-Pacific DX at my location in western Canada can be spotty at the best of times.  This means spotty as in a “zero to zero in 60 seconds” sort of spotty, because a signal can literally fade up 10 or 15dB to a readable level in 20 seconds, perhaps with identifiable material, then disappear just as quickly.   My best example so far this season was on 1593kHz, early in the UTC day of 16 November 2020, when a Romanian station on that channel paid a brief visit to my receiver in western Canada.  An initial inkling of that showed up in a Carrier Sleuth waterfall, a blotch of dark red at 0358UT, and indicated by the yellow arrow in Figure 4; that caused me to go back to the recorded SDR files that had generated these traces.

The dark blotch indicates a 10dB rise and fall in signal strength including about 60 seconds of rough audio, which turned out to be the choral version of the Romanian national anthem (RCluj1593.wav).  That one carrier and another one both started up at 0350UT, the listed sign-on time for Radio Cluj, which does indeed begin the broadcast day with that choral anthem.   Which one of the Radio Cluj transmitters was heard is still an open question, due to the lack of carrier sleuths (computerized or otherwise) on the ground in Romania,  but the more powerful one listed is a mere 15kw, so I will take either.

Finally, for those who have interest in radio propagation, the Carrier Sleuth displays can reveal some odd anomalies, for example, Figure 5 which displays both Radio Taiwan International (near 1557.000kHz on 28 November, but varies from day to day), and CNR2 (1557.004kHz)  carriers as local sunrise at 1542UT approached in Victoria, BC.

Figure 5

The diffuseness of the carriers is striking, as is their tendency to shift higher in frequency at local sunrise.  This doesn’t seem to be some strangeness in the original SDR recording, as there appear to be unaffected weak carriers on the channel.  For comparison, Figure 3 shows the same recorded time and date, but on 1287kHz, and JOHR’s carrier is pretty stable, but there are others on that channel that show the shift higher in frequency around local sunrise.  As one goes lower in frequency, these shifts became smaller and less common on each 9kHz channel, and disappear below about 1000kHz.    On later mornings, however, the shifts could be found right down to the bottom of the MW band.  Certainly, these observations are food for further thought.

Many of the parameters in Carrier Sleuth are adjustable by the user, for example, the sliders at the top of the screen can allow adjustment of the color palette to be more revealing of differences in signal strength.   The passband shown is also easily changed, and in fact, setting  the passband width to 400Hz, instead of my usual 50Hz , and creating another run of the program on 1557kHz, shows very clearly the sidebands of the “the Rumbler”, a possible jammer on the channel  (Figure 6).  Incidentally, a lot of the traces around 1557.000kHz in Figure 5 may well be part of “the Rumbler” signal as well, as filtering of the audio doesn’t seem to improve readability on the channel.

Although the examples here are taken from DXing overseas signals from western Canada, there is no reason why similar techniques may  not be applied to domestic DXing, particularly during the daytime, when signals can be weak, but can fade up unpredictable for brief periods.

Figure 6

How to create these waterfall displays in Carrier Sleuth?

So, how can you get these displays for yourself?  A “try before you buy” version of the program is available at http://blackcatsystems.com/software/medium_wave_carrier_display_app.html  and both the website and the program itself contain a quite detailed set of instructions.    However, the 25 cent tour can be summarized this way:

You start with a group of supported SDR data files, previously recorded, and use “Open I/Q data files” in the File drop down menu. Figure 7 shows the window that will open to allow you to choose any number of the files from your stored SDR files, by clicking the Add Files button  circled in red.  Then choose one of the options inside the green circle in Figure 7.  They are explained in more detail in the help write up; note that the “Custom Channel” can be specified to considerably more precision than just integer kHz values, e.g. 1205.952     The rest of the settings you will probably adapt to your needs as you gain experience.   Finally, set an output file name using the Set Output File button, and hit the “Process” button at the bottom of the window. There are a couple of colored bars in the upper right hand corner of the display that indicate progress, along with number of seconds left, although these are not always visible.

Figure 7

The generation of these waterfalls takes time.   A computer with a faster CPU and more memory will speed things up.  There is, however, an important limitation of the program.  It is specified for 32-bit systems, and although it will run with no problem on 64-bit systems, individual input I/Q files are therefore restricted to 2GB or less.   Many SDR users now choose to create larger files than this, and Carrier Sleuth will not handle them.  Another possible limitation can occur when processing 32M FFTs, which are useful for delivering very fine frequency resolution of the carriers displayed.   The program really requires in excess of 4GB of memory to handle the computation needed to deliver this fine a scale.  Unfortunately, both the 2GB file size limitation and insufficient memory limitation deliver generic error messages, followed by program termination, which leaves the inexperienced user none the wiser about the true problem.

This might be a good place for a word about FFT size and Resolution Bandwidth (RBW).  The FFT is a mathematical computation that takes as its input the samples of digital data that an SDR generates (or those samples that  have been saved in recorded files), and generates a set of “bins”, which are individual numbers representing signal strength at a defined number of consecutive frequencies spaced across the full bandwidth being monitored by the SDR. You could think of these bins as a series of tiny consecutive RF filters, spread across the band, each delivering its own signal strength.   As we are trying to look at fine scale differences in frequency when using a program like Carrier Sleuth, it is important that these little “RF filters”, or bins, each have a very narrow bandwidth.  This value is called “Resolution Band Width” (RBW), and preferably should be a fraction of a Hertz to get displays such as those shown in Figures 3 through 5.

The “FFT Length” is the number of bins that the FFT display contains, and is equal to the number of I/Q samples (either from the SDR or recorded file) that are used for the input to its computation.  The relationship between FFT Length, the bandwidth of the SDR or of the original recorded I/Q file, and the RBW is fairly simple:

Because the MW DXer is usually looking at data with 1MHz or more bandwidth, this equation tells us that to get a smaller than 1Hz RBW, we will need to have an FFT length of well over  one million bins, so it would be wise to use an FFT length at least 8M(illion).   If you are looking at a recorded file that is from an SDR using a lower bandwidth, then a lower FFT length will do the job to get a smaller RBW.

A downside of using a long FFT length is that the time resolution of the FFT becomes poorer, resulting in a display in Carrier Sleuth that will appear to be compressed from top to bottom compared with what was seen when recording the SDR file, and with correspondingly less response to fast changes in signal strength.   However, using a 16M FFT Length on a recording of the MW band results in a time resolution of about 12 seconds, so it should not be a deal breaker for most.

Producing signal strength plots 

A further specialist activity for some DXers is recording signal strength on specific channels, and then displaying the progress of signal strength versus time, often to indicate when openings have occurred in the past  (say, at transmitter sunset),  and perhaps allowing one to predict such openings in the future.    But, the world has come a long way from the noting down of S-meter readings at regular time intervals, both in deriving signal strength and in plotting the results.  Read on for an example.

Figure 8

Carrier Sleuth recently added the capability of creating files containing signal strength versus time for specified frequencies, and, depending on the size of RBW, to deliver that signal strength as observed in a passband as narrow as 0.05Hz, or as wide as 10Hz.   The program extracts the signal strength information from one of the FFT files that it has already generated from a selection of SDR I/Q files.   In Figure 5, two stations’ signals, from Radio Taiwan International, and from CNR2, were featured in the display.   With roughly 4Hz difference between the two signals, it is easily possible with Carrier Sleuth to derive signal strength from each one, specifying a bandwidth of, say 1.2Hz, to account for the propagation induced drifts and smearing of the carriers, not to mention any drift in either the receiver or transmitter.

The program creates a .csv file (text with comma delimiters) of signal strength versus time for all the frequencies chosen from an individual FFT file, but does not plot them.  There are several programs that can create plots from CSV files   For example, an Excel plot generated from Figure 5 is in Figure 8, showing peaks in those signals that occurred both before and after local sunrise at 15:42UTC.   Note that the user is not restricted to the signals found on just one of the waterfalls that are found in the FFT file, but can pick and choose dozens of signals found anywhere in those waterfalls.    (Note also that one can choose locations on any waterfall where there is no signal trace, in order to provide a “background level versus time” in the finished plots, if desired)

The process used to generate this CSV file involves searching through the FFT waterfalls for signal traces that are likely candidates for adding to such a file.   On the first candidate found, the user right clicks the mouse on the trace, at the exact frequency desired; this will bring up an editable window.   The window will show the chosen frequency as well as any subsequent ones that will be chosen, then the overall selection is saved to a text file after editing, so that the user can move on to generating the CSV file.

That file is created by going to the File drop down menu, and choosing “Generate CSV File”, where the text file produced earlier can be chosen.  Once that file is selected, the CSV file is immediately generated, and can then be manipulated separately as the user chooses.

Are there comparable programs?

Displaying waterfalls in SDR programs playing back their own files is nothing new, though not that many can do it at as fine a scale as Carrier Sleuth does, and most programs are not optimized to handle such a variety of input I/Q files.

One that does read a fair number of different kinds of SDR files is the SDR Console program; this includes Data File Analyser (64-bit only) which also can display carrier tracks to a high resolution, so let’s take a quick look at what Analyser does.  If you are familiar with SDR Console, and are reasonably experienced with the way it handles your SDR or plays back files from your favored SDR software, then these online instructions https://www.sdr-radio.com/analyser will help you get started with Analyser

This program will input a group of SDR files, then display an equivalent to a single one of the waterfalls output by Carrier Sleuth, displaying the carrier traces in reverse order, with time running from bottom to top of the display. Figure 9 shows the equivalent of Carrier Sleuth’s display of the 1287kHz carrier traces shown in Figure 3.    Analyser has a convenient sliding cross hair arrangement (shown in the yellow oval) to reveal time and frequency at any point in the display, but the actual signal power available at that point must be derived from the rough RGB scale along the left hand border. Analyser is apparently capable of about 0.02Hz resolution when reading from full bandwidth medium wave SDR files, but the default is to display exact frequency only to the nearest Hertz. The “Crosshairs” ribbon item has a drop down of “High-Resolution”  which displays to the nearest milliHertz however, though that will be limited by the actual RBW of the generated display.   The graphic display can be saved as a project after the initial generation of the signal traces, which allows the user to return to the display without having to generate it all over again, equivalent to opening one of Carrier Sleuth’s FFT files.

A useful facility in Analyser is the ability to click “Start” in the Playback segment of the ribbon above an Analyser display, then mouse over and click on a signal trace; this action will play back the audio for that channel in SDR Console, at that point in time.

It is possible to generate a signal strength plot of signal strength versus time for any individual frequency in the waterfall display, and to save that plot as a CSV file (“Signal History”).   But, the signal strength is that found only in a +/- 0.5Hz passband around the chosen frequency, with no other possibilities.  If you want to generate a plot for another frequency on the same waterfall, then you will need to run the process again, and if you want a plot for another frequency in the SDR files, then you need to generate another waterfall, which, depending on your computer’s capability, could take some time.   On an i3 CPU-based netbook with 4GB of memory, it took 30 minutes to produce one frequency’s worth of traces from data files scanning three hours.  On the same machine, Carrier Sleuth could deliver all 9kHz channels in 1hr20min from the 3 hours of files.  However, it also took 1hr20min to play back just one channel in Carrier Sleuth, which is not so efficient. (further note:   Nils Schiffhauer has developed a technique to speed up Data Analyser processing, by first using Console’s Data File Editor on full bandwidth MW recorded files; details will likely appear at https://dk8ok.org)

To conclude then, SDR Console’s Analyser will produce a display of a single channel faster than Carrier Sleuth will, and will play back the audio associated with that channel, while also having the capability to plot and record signal strength for a single given frequency within that display, but only on 64-bit computers.  It can also handle SDR files larger than 2GB in size, and will run more quickly if a NVIDIA graphics card has been installed.   Analyser is also strict about sequence of files.  If there is the slightest gap between one file finishing, and the next file starting in time sequence, it regards that as a new set, that will need to be processed separately.

Where Carrier Sleuth is more useful is that once an FFT file has been generated, it is easy to quickly check multiple channels for interesting openings during the recorded time period. It can also provide very precise frequencies of carriers, and is able to generate a file of signal strengths versus time from multiple frequencies, including those frequencies that are separated by barely more than the RBW.  For the MW band, that can be near 0.1Hz, often beyond the capability of transmitters to be that stable.  See Figure 10, which shows signal strength traces from JOCB and HLQH both on 558kHz, and separated in frequency by 0.1Hz.    At 1324UTC, JOCR dominates with men in Japanese, and at 1356UTC, the familiar woman in Korean dominates, indicating HLQH.

Figure 9

Figure 10

Incidentally, another program that seems to offer a similar functionality to Carrier Sleuth and SDR Console’s Analyser is, of course, Jaguar, which has made a point of displaying 0.1Hz readout resolution when using the Perseus SDR, and in playing back Perseus files, but…only Perseus.  There is a capability called Hi-Res in Jaguar Pro that can be applied when playing back files; this also displays fine scale traces of frequency versus the passage of time.  Steve VE6WZ, sent the example shown in Figure 11, zeroing in on his logging of DZAR-1026.  As with Analyser, clicking on a certain point in the display plays back the audio at that time, but it is unclear at this point whether the display can be saved, or whether it is generated only for one individual channel, and then is lost.

Figure 11

+   +   +   +   +   +   +   +   +   +   +   +

Availability

Carrier Sleuth  http://blackcatsystems.com/software/medium_wave_carrier_display_app.html

Analyser (SDR Console)   https://www.sdr-radio.com/download

Jaguar   http://jaguars.kapsi.fi/download/ (these are the Lite versions; to unlock the Pro version, purchase is needed)

(this article first appeared in International Radio Club of America’s DX Monitor)


Many thanks, Nick. This is amazing. What a brilliant tool to find nuances of a DX signal. I can’t help but marvel at the applications we enthusiasts have available today. Thank you for sharing!

Spread the radio love

Radio Waves: New Quantum Receiver, Virus and Distance Learning by Radio, BBC Woofferton Early Days, and Hello Morse

Radio Waves:  Stories Making Waves in the World of Radio

Because I keep my ear to the waves, as well as receive many tips from others who do the same, I find myself privy to radio-related stories that might interest SWLing Post readers.  To that end: Welcome to the SWLing Post’s Radio Waves, a collection of links to interesting stories making waves in the world of radio. Enjoy!
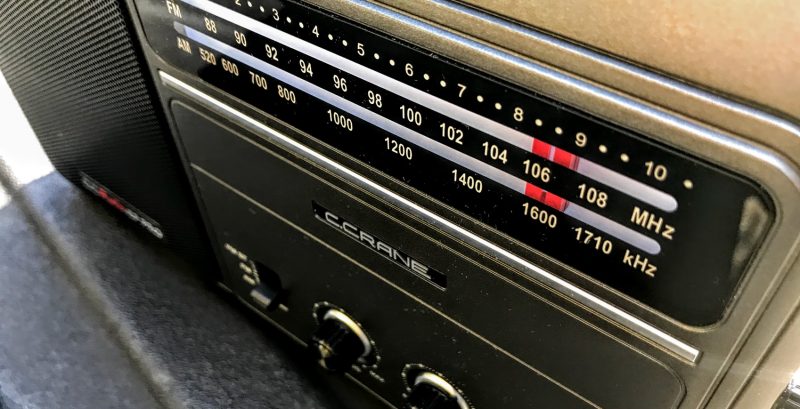
Many thanks to SWLing Post contributors Andrea, Kim Andrew Elliott, Dave Porter, and Phillip Novak for the following tips:


New quantum receiver the first to detect entire radio frequency spectrum (Phys.org)

A new quantum sensor can analyze the full spectrum of radio frequency and real-world signals, unleashing new potentials for soldier communications, spectrum awareness and electronic warfare.

Army researchers built the quantum sensor, which can sample the radio-frequency spectrum—from zero frequency up to 20 GHz—and detect AM and FM radio, Bluetooth, Wi-Fi and other communication signals.

The Rydberg sensor uses laser beams to create highly-excited Rydberg atoms directly above a microwave circuit, to boost and hone in on the portion of the spectrum being measured. The Rydberg atoms are sensitive to the circuit’s voltage, enabling the device to be used as a sensitive probe for the wide range of signals in the RF spectrum.

“All previous demonstrations of Rydberg atomic sensors have only been able to sense small and specific regions of the RF spectrum, but our sensor now operates continuously over a wide frequency range for the first time,” said Dr. Kevin Cox, a researcher at the U.S. Army Combat Capabilities Development Command, now known as DEVCOM, Army Research Laboratory. “This is a really important step toward proving that quantum sensors can provide a new, and dominant, set of capabilities for our Soldiers, who are operating in an increasingly complex electro-magnetic battlespace.”

The Rydberg spectrum analyzer has the potential to surpass fundamental limitations of traditional electronics in sensitivity, bandwidth and frequency range. Because of this, the lab’s Rydberg spectrum analyzer and other quantum sensors have the potential to unlock a new frontier of Army sensors for spectrum awareness, electronic warfare, sensing and communications—part of the Army’s modernization strategy.

“Devices that are based on quantum constituents are one of the Army’s top priorities to enable technical surprise in the competitive future battlespace,” said Army researcher Dr. David Meyer. “Quantum sensors in general, including the one demonstrated here, offer unparalleled sensitivity and accuracy to detect a wide range of mission-critical signals.”

The peer-reviewed journal Physical Review Applied published the researchers’ findings, Waveguide-coupled Rydberg spectrum analyzer from 0 to 20 GigaHerz, co-authored by Army researchers Drs. David Meyer, Paul Kunz, and Kevin Cox[]

Virus and distance learning by radio (1937, 1946) (AE5X Blog)

Six to eight decades ago polio was one of the most feared diseases in the US. In 1952 alone, 60,000 children were infected, 3000 died and many more were paralyzed.
The most severe outbreaks were in 1937 and 1946. My father was a victim of the 1946 epidemic, suffering minor paralysis in one leg as a child.

In 1937, many schools around the country closed, as did public pools, movie theaters and parks. But the Chicago public school system took an innovative approach.

During that period, 80% of US households contained a radio. This allowed 325,000 children in grades 3-8 to continue their education at home via radio lessons aired by six Chicago radio stations (WENR, WLS, WIND, WJJD, WCFL, WGN) that donated time for the purpose.

Program schedules for each day were printed in the morning paper. Home with more than one radio & more than one child often set up radios in different rooms so that each child could hear the appropriate grade’s lesson.

This continued for one month…until schools reopened in late September of that year.

Curriculum was developed by teachers and monitored over the air by school officials. After each episode, a limited number of teachers were available for phone calls. A large number of the calls were from parents distressed that they could not clearly receive the broadcasts.[Continue reading…]

BBC Woofferton Early Days (Ludlow Heritage News) [PDF]

Very few structures are left in the Ludlow area which can be traced back to the Second World War. However, look five miles south of the town towards the rise of the hills and a tracery of masts can be seen. Go closer, and a large building can be found by the road to Orleton, surrounded now by a flock of satellite dishes, pointing upwards. The dishes are a sign of the recent past, but the large low building was made for the war-time radio station aimed at Germany.

This little history attempts to tell the story of the British Broadcasting Corporation’s transmitting station at Woofferton near Ludlow in Shropshire during the first years of its existence. When and why did the BBC appear in the Welsh border landscape with a vast array of masts and wires strung up in the air? The story begins in 1932, when the BBC Empire Service opened from the first station at Daventry in Northamptonshire. Originally, the service, to link the Empire by wireless, was intended to be transmitted on long-wave or low frequency. But, following the discovery by radio amateurs that long distance communication was possible by using high frequency or short waves, the plan was changed. Later in the decade, the BBC expanded the service by also broadcasting in foreign languages. Although Daventry had a distinguished name in the broadcasting world, it was never technically the best place for a short-wave site, being on a hill and close to a growing town.

This article can be found in the Ludlow Heritage News: click here to download the full PDF.


Hello Morse: A collection of AI and Chrome experiments inspired by Morse code on Android Gboard (Google)

Developer Tania Finlayson found her voice through Morse code. Now she’s partnering with Google to bring Morse code to Gboard, so others can try it for accessible communication.

Morse code for Gboard includes settings that allow users to customize the keyboard to their unique usage needs. It works in tandem with Android Accessibility features like Switch Access and Point Scan.

This provides access to Gboard’s AI driven predictions and suggestions, as well as an entry point to AI-powered products, like the Google Assistant.[]


Do you enjoy the SWLing Post?

Please consider supporting us via Patreon or our Coffee Fund!

Your support makes articles like this one possible. Thank you!

Spread the radio love

WRTH 2021: A look inside the 75th Anniversary Edition!

Last week, I received a long-awaited Christmas gift: the 2021 World Radio TV Handbook. Normally, I’d receive this annual guide in the December time frame, but because of delays in international postal services due to the Covid-19 pandemic, I took delivery a few weeks late.  

I always look forward to receiving this excellent staple radio reference guide–and this is their 75th edition! As I say each year, the WRTH has never disappointed, so my expectations are always quite high.

Once again, the WRTH lived up to my expectations.

WRTH’s team of noted DXers from around the world curate frequencies and broadcaster information by region; while I’m not sure how they orchestrate all of this, the end result is truly a symphony of radio information. In addition to broadcaster listings, WRTH’s radio reviews, feature articles, and annual HF report make for excellent reading.

But the WRTH isn’t just a frequency guide: the publication always devotes the first sixty or so pages to articles relating to various aspects of the radio hobby. Following, I offer a quick overview of these.

The first article always features a WRTH contributor:  this year, they feature Stig Hartvig Nielson. His path to becoming a WRTH contributor began in his childhood when he said he was “tall enough to reach the radio tuning knob and tune away from dull Radio Denmark.”  His love of radio lead him down the path of becoming a broadcaster. Many of us know him via his station, Radio208.

WRTH Reviews

The second set of articles is always my favorite: WRTH receiver reviews.

This year, WRTH begins with an in-depth review of the AOR AR5700D wideband communications receiver–a radio I’d likely never touch in real-life, so it’s wonderful to take such a deep dive.  Next up is a review of the Bonito NTi MegaDipol MD300DX antenna which gets high marks for high gain, low noise, and good dynamic range. The following in-depth review is of the benchmark Icom IC-7610 general coverage transceiver. This was the first time I’ve read a review of this SDR transceiver with radio listeners in mind. WRTH then review the Bonito NTi CCMC30 common mode noise filter–a tool that can help radio enthusiasts mitigate RFI.

A review of the SDRplay RSPdx follows and the review speaks to the performance improvements included with the new HDR mode. The next review is actually one I authored of the Tecsun PL-990 portable radio–it’s always an honor to be in the pages of the WRTH!

The final review is of the Valent F(x) KiwiSDR; a little web-connected SDR receiver that has certainly transformed the nature and accessibility of remote listening.

WRTH Features

The first feature article, written by none other than Dave Porter, focuses on the development of HF broadcast transmitters. This article adds to the one he authored last year which focused on broadcast antennas. Dave is amazing because he has such an extensive history in the world of HF broadcasting and his experience and expertise are obvious in all of his writing. This is a must-read for those who want to know more about the “business side” of an international broadcast signal!

Manfred Rippich’s feature, Radio in Bhutan, explores the story of broadcasting in one of the most mountainous countries in the world where communities–including the capitol–are not easily accessible. Radio broadcasting plays an important role in this amazing country.

The following feature, Coastwatchers & the AWA Teleradio 3BZ written by Dr Martin Hadlow, takes a look at the importance of portable radios in the Pacific War. An absolutely fascinating piece for those of us who love radio history.

The final feature was written by Alan Pennington and explores the dynamic Scandinavian Weekend Radio.  It’s hard to believe SWR has celebrated 20 years on the air as of 2020. Pennington’s article explores the grassroots energy of this unique broadcaster!

The final article–a tradition–is the WRTH  HF propagation report/forecast by Ulf-Peter Hoppe. Always an informative read especially as we continue to work our way out of a long-term solar slump.

The 75th is another fantastic edition of the World Radio TV Handbook. As I say every year, I’ve never been disappointed with WRTH. Their publishing standards are such that the quality of their reviews, their writing, and (most importantly) their broadcast listings are simply unparalleled.

For DXers who collect QSL cards, you’ll find that broadcaster contact information in WRTH is often more up-to-date than a broadcaster’s own website. When readers contact me asking for QSL information from an obscure broadcaster, the first place I search is the current WRTH. Remember: their information is based on volunteer contributors who specialize in specific regions of the world–the most knowledgeable regional DXers keep this publication accurate.

Purchase your copy of WRTH 2020 directly from WRTH’s publishers, or from a distributor like Universal Radio (US) , Amazon.com (US),  or the Book Depository (international).

Spread the radio love

National Public Broadcasting Company of Ukraine resumes mediumwave broadcasting

Many thanks to SWLing Post contributor,  Vlad (US7IGN), who writes:

Hello!

I hasten to inform you the good news that Ukrainian radio resumes broadcasting on medium waves.

At a time when the whole world is curtailing broadcasting, a new station has appeared on the air!

From February 1, the National Public Television and Radio Company of Ukraine will resume broadcasting UA: Ukrainian radio in the medium-wave band on the frequency 549 KHz.

The medium-wave transmitter of UA: Ukrainian radio in the village of Luch, Mykolaiv region, with a capacity of 500 kW, covers most of the territory of Ukraine (during the day – 60% of the territory including the occupied territories, from evening to morning – the whole territory of Ukraine).

http://uarl.info/news/ukrainskoe_radio_vosstanavlivaet_veschanie_na_srednih_volnah

Brilliant news–many thanks for the tip, Vlad!

Spread the radio love

The Icom IC-705 is about to achieve ‘Holy Grail’ status

In 2019, shortly after Icom announced the Icom IC-705, I speculated that this rig might be a contender for “Holy Grail” status.

I must admit…the more I use this radio, the more I love it. It is a proper Swiss Army Knife of a radio. Even though I’ve owned and operated it for a few months, I still haven’t explored all that it can do, and I keep finding features I love.

Case in point

Yesterday, I upgraded my IC-705’s firmware. Unlike other devices I’ve been evaluating recently, IC-705 firmware updates aren’t fixing numerous bugs and issues, rather they’re adding more functionality.

After completing the upgrade, I hooked the ‘705 up to my main antenna and worked a few Parks On The Air (POTA) stations off of the supplied battery pack (instead of a power supply). While I worked on other projects in the shack, I checked the POTA spots and work a few stations with a whopping 5 watts of output power.

After a couple hours on the air (mostly listening), the internal battery pack still had a good 60-70% capacity.

At one point, I tried a little daytime mediumwave DXing and cruised past 630 kHz which some of you might already know is the home of one of my favorite hometown radio stations, WAIZ.

From my home, WAIZ is a tough catch, so it was weak, but I could hear it.

This reminded me that I had made a recording of WAIZ with the IC-705 when in my hometown earlier this month.

Normally, I pull the MicroSD card out of the IC-705–which almost requires needle nose pliers and is one of my few complaints about this rig–and view the files on my PC or MacBook, but I was curious if perhaps the IC-705 software had a built-in file display.

Of course it does!

Simply press the MENU button, then the RECORD button on the touch screen, and you’ll see the following selections:

Press “Play Files” and you then see a list of folders organized by date:

Click on a folder and you’ll see a list of recordings made that day:

Here’s the genius bit for those of us who like to archive broadcast recordings…the IC-705 embeds the following meta data:

  • Date of recording
  • Start time of recording
  • Recording length
  • Frequency
  • Mode

These are some of the most important pieces of information I use to index my audio recordings and the IC-705 does this automatically.  In fact, if you allow the IC-705 to gather its time information from the internal GPS, the time stamp will be incredibly accurate.

The only thing I add to the file name after export is the broadcaster name/station callsign.

If that wasn’t enough, if you touch one of the recording files, the IC-705 will open it in an audio player:

The built-in player displays the meta data, and even includes a number of controls like fast-forward, rewind, skip to next or previous file. and pause.

I’m sure this is the same audio player found in the IC-7300, IC-R8600 and other late-model Icom SDR rigs. But in a portable battery powered transceiver? This is a genius feature.

As I type this post I’m listening to the audio from the WAIZ file shown above. I can imagine when I’m able to travel again (post-pandemic), how useful this will for one-bag air travel.

(If you’d like to listen to WAIZ, check out these ‘705 recordings.)

Not only is the IC-705 a QRP transceiver and wideband multi-mode general coverage receiver, but it’s a recorder and audio player with a built-in front-facing speaker. I can set this transceiver at my hotel bedside and listen to recordings I made in the field earlier that day or week.

Keep in mind that the IC-705 is an expensive radio–certainly one of the most pricey QRP radios ever produced at $1,300 US (at time of posting although I’m sure we’ll start seeing lower pricing this year). But if you’re an SWL and ham, you’ll find the IC-705 is the most versatile portable transceiver on the market. If you’re an SWL only, you can disable the transmit on the IC-705 and essentially have a portable battery-powered SDR receiver with built-in audio recording and playback with color touch screen spectrum and waterfall display.

Despite the price, this is Holy Grail territory in my book.

Icom IC-705 Review

If you subscribe to The Spectrum Monitor magazine, you’ll be able to read my (4,000 word!) review of the IC-705 in the upcoming February 2021 issue.

Spread the radio love

The new Sangean SG-108 portable HD radio

Many thanks for SWLing Post contributor, Zack Schindler, who shares the following:

Sangean released a new MW/FM/HDRadio this year, the SG-108: https://www.sangean.com/products/product.asp?mid=261&cid=3

It seems to be identical to the HDR-14 except for the color https://www.sangean.com/products/product.asp?mid=230&cid=3.

I wonder if the receiver is any better than the HDR-14? I have an HDR-14 and am amazed by its performance every time I use it.

Thanks for the tip, Zack! I, too, love the HDR-14. I also love the fact the SG-108 still uses AA batteries as well.

Spread the radio love